Summary:
Per the trading plan (posted today) : I decided that $200 was the most I wanted lose on 20 consecutive stops. Assuming an average stop loss of $0.10 that came to 100 share lots.I was doing pretty well until the end of the day and I went in on TNA for some crazy action with 500 share orders. The profit potential was beckoning to me with long red candles and rather than ramping up from 100 shares and setting proper stops, I got greedy - and got burned for it. Heh.
So for the record - I didn't adhere to the plan for the last 15 minutes of the day, and on two SNDK trades (the bounce off the 9:40 dump).
Score: 0. That is the tally (in terms of consecutive days adhering to the plan). If you want to see how much I lost you can scroll down thru the details and add it up. TNA pretty much says it all.
I like the plan. I like the change in focus and I like how it concentrates my trading - when I adhere to it.
I have mixed feelings about what should happen from here on out. I think I had one positive day this week? For the month I am negative - after seeing some healthy profits.
This has happened before...
Einstein and something he said about insanity comes to mind.
It is pretty obvious that I still have a ways to go. The market seemingly seduces the inexperienced trader with simple - easy - money, gets them hooked and reels it all back in and then some with a vengeance. I simply do not have the experience/skill-set to recognize and cope with a variety of market conditions. I am just not sure I could of recognized or believed this without actually experiencing it. Easy lessons, pfft... who needs 'em?
I don't think the goal here is to have the skills to trade in every type of market prior to trading, market dynamics make that impossible. Rather - I think it is to develop and adhere to a plan that allows me to safely adapt to the market dynamic du jour. Adhere to a plan that offers, provides, and protects the freedom to trade this game well. Protects me from myself.
I still have some money left. And I think I finally have something like a real plan - a plan that I have paid for and call my own. I didn't intentionally leave out technical indicators, but it was kind of cool when I realized the plan didn't have any. Heh.
Now I need to be able to stick to the plan. Not that I have an abundance of wisdom at my disposal, but I think it would unwise to move forward without a track record of adhering to the plan.
So here is what I am thinking: paper trading until I have a 5 consecutive-days-sticking-to-the-plan tally. After 5 consecutive days I will switch to live trading. If I deviate from the plan while trading live, I go back to the consecutive day paper trading tally.
Pfft. I have no idea what I am doing here. Who am I kidding?
On another note, I had some great entries today (while I was sticking to the plan). Some great reads. Always room for improvement, but it was fun. If I would of been scalping a 15 to 20 tick profit I think I would have been upwards of 80% on profitable trades. I am sure scalping is all there is to get sometimes, but I want to try and avoid the habit.
A couple of entries saw stops less than a dime and I got hit by a couple of ticks away from momo support, only to see it go the right direction. I am considering a minimum stop loss limit.
A couple of entries saw stops less than a dime and I got hit by a couple of ticks away from momo support, only to see it go the right direction. I am considering a minimum stop loss limit.
Overall, more attention to the market price action and market volume is in order. The 9:10 climb to the 9:35 doji on the Q should have been a dead give away. I missed it, but happened to be short on two positions based on the stock pattern. The 11:15 uptick on big green volume coming off of the 11:10 low should of been another signal - I came in wrong on a number of positions right around then and I think a good market read would of avoided these. I was still thinking the momo was with the shorts. I am not sure how to read the 11:55 spike - I want to say exhaustion, but it is probably better to say more momo:

Have a great weekend - I think I will try to avoid thinking about trading, but hard telling how successful I will be at it.
Details:
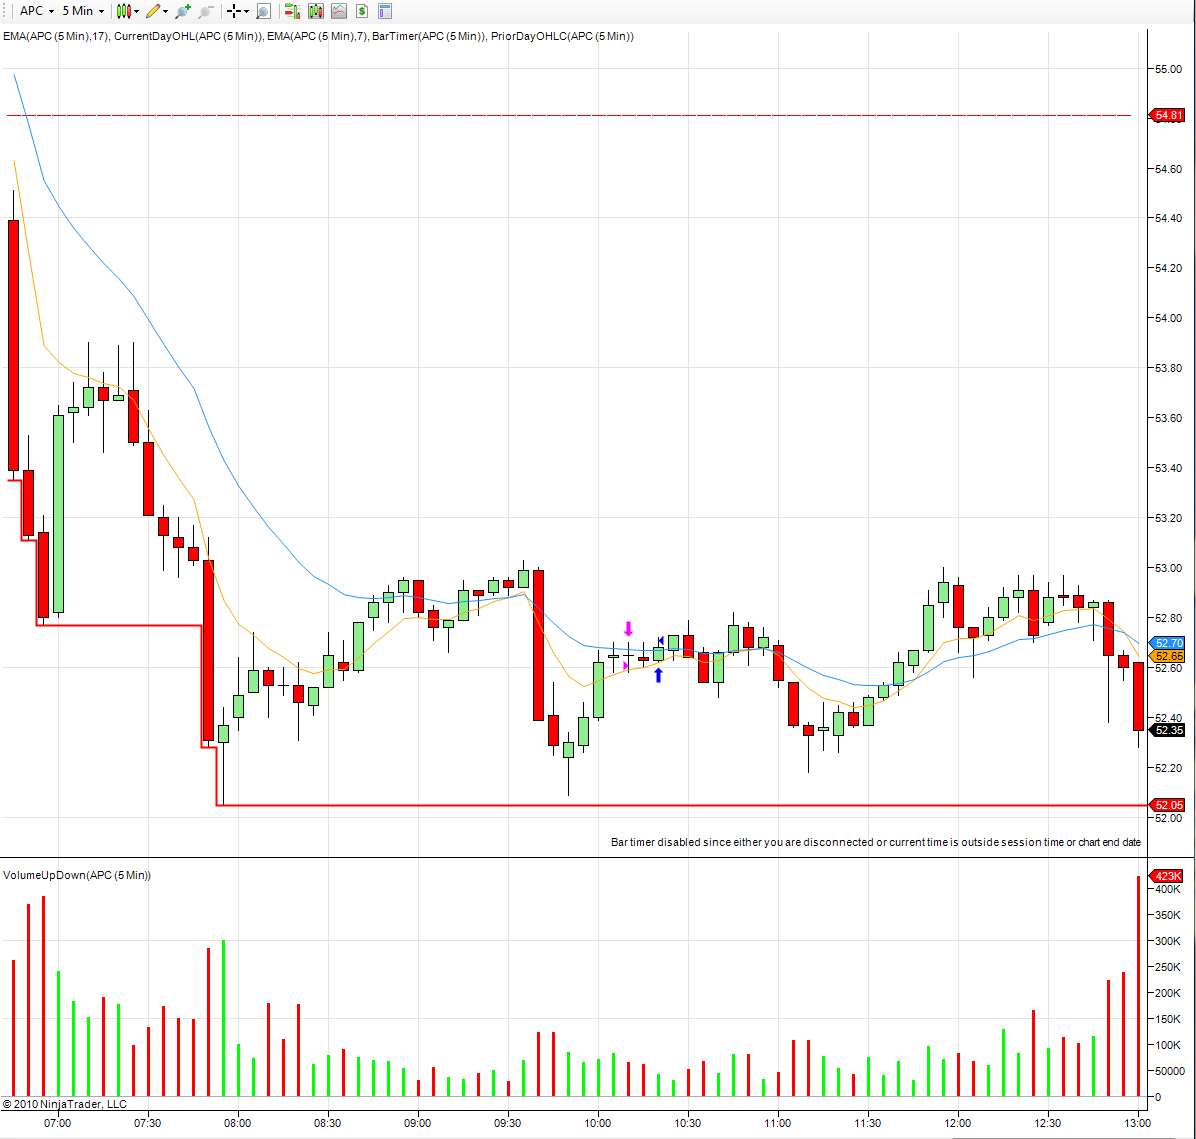
Instead of narrating every transaction, I am going to let the charts speak for themselves and add a few comments of interest. Pink triangle is a sell, blue triangle is a buy. Left side of the candle is an entry, right side is an exit.
APA - well executed. If I would of traded one last time, I am almost sure I would have been long on the bottom side of the 9:35 (which would have been a fail), but I was holding other positions (-$26.64):

APC (-$11.83):
Expecting a continuation on the trend on DE and entered on what I thought was support. I missed the accompanying volume spike and uptick on the Q's (-$6.82):

Looks like the stop was a little lower than it should of been on DO's short - two pennies under the support, but I probably still would have been stopped with the long stopping wick 3 pennies above. Lesson? I probably should adopt some minimum stop loss (-$6.53):

Bought on FCN's support side and tried to reverse and then hopped back on (+45.69):

FFIV: A better price point or a minimum stop loss may have kept me out of this stop (-$9.52):

Several attempts at the short on FTI all with great market support (-$30.70):

GR: This entry was coming off of a red candle on the market and it looked good - but I neglected the Q volume spike @11:15. However, it is likely that I would call it the same way next time given the volume on GR's immediate reds and the doji (-$4.60):

JCG (-$10.39):

MTB didn't have a lot of support for the stop, but the increased volume on the doji begged me to try. How to explain the exit? Lack of support for the stop. I can't blame the uptick in red volume because I was out on the candle change. Again - a better gage on the market would of lent support for a better decision (+$19.25):

OII was trending. I got stopped out a couple of times before I got it right - and it was on the slow EMA and earlier support - which I noticed on the last entry and took the chance. 70 ticks at best, and I doubled down as it seemed to bump against the ceiling. The next few candles were extremely tough to read, but looking at it now, increasing green volume should have been the signal to think about getting out. If anyone has anything to add, feel free (-$61.32):

The short entry on PNC looks late, but after checking the distance to the ceiling I was ok with entering. I tried again after the stop and closed as the market kept creeping up (-$17.03):

RIG: I am not sure what happened to the stop here - there was no slip, very poor placement (-$17.54):

The close on the slow EMA prompted the short which came late on the candle change (0:51). This entry leaves me scratching my head - was not supported at all. The market was showing some weakness on the second entry (-$18.80):

SNDK - the big down move caught me in some technical glitches - NT was coming up with some order errors - so I was unable to scale up. I went out of plan mode and worked some 500 share orders on the bounce, but I was not reading things very well and ended up breaking even. Again - Q's - and SNDK - left a great signal on the 11:15 (+$21.07):

SPN looked to be trending and I bought close to 'return to trend' support. Seems like I was reading the market wrong - or not paying attention at all on the 11:25 mark (+$43.35):

I feel like I should apologize for TNA, and unfortunately, I blew the plan and tried to trade 500 shares on the last candles. Long wicks - freakin evil. I was actually short on the 12:40 with a good price point, but that long wick(ed) action shook me out. Prior to that it was a mixed bag - I had 4 positive trades out of 14, with 7 more of those showing some positive action before stopping. I am not sure what to say about TNA - when it moves it moves nicely - away from price point. That might be key. Blew the budget. (-$520.83):

XEC basically ignored the rest of the market on this entry. I got an excellent price point. Can't tell what happened with the stop here, but it may have been spread (-$19.44):

Hey man, while looking through some of your trades I noticed that you held for an extended period on some. Great job in holding some trades longer! It may not necessarily go along with your plan, and I am not sure if you are scalping only or not, but it does show some growing patience and comfort with uncertainty. That TNA chart does look pretty brutal, and I am sure it felt that way. It appears you became caught up with trying to trade out some emotions, I'm not sure. Keep up the good work!
ReplyDeleteBob, terrific plan! Not sure if it will help you, but a Jim Rogers (famous trader interviewed in the book "Market Wizards") quote resonated with me. He said that one of the most important rules in trading is to do nothing, absolutely nothing, unless there is something to do. After thinking about this I got very selective with my trades and my trade count went from 25+ trades per day to under 10. I also went from being an unprofitable trader to slightly profitable now. Not sure if it will be helpful to you but it helped me.
ReplyDeleteThanks for the input gents - have a great weekend!
ReplyDeletefirst, einstein reference is great.
ReplyDeletetake a look at my q chart. i didn't get that volume spike at 1155, pretty funny.
apa chart, here is one of my same questions, does the 925 doji (i would short it) take precedent or the 935 doji (i would long it, like you). here the 925 short doji took precedent. one way i am trying to figure it out is buy watching the next candle. check out the 940 candle, did it ever break the high of the doji, no. did it break the low, yes. well then stay on the short side. i'm going to be watching this closely to see if i can discern a pattern. unfortunately, this chart was helped by the doji no the q's and the crazy self off, so i will have to check more charts.
DE explanation is strange, "bought support" but it looks like you shorted it (after checking the DO chart, i think you are referring to near term resistance, no?). even though it had a big downtrend all day, i thought you would have bought after a hammer and doji. its funny thought, the 1050 and 1055 candles did almost the exact same thing and continued down. i guess this is why we have to trade ever trade that comes our way, believe in the percentages, and most important, hold the winners.
FCN that is how you trade a chart. well done.that is fearless trading at its best.
okay, here is another random thought after looking at your charts. getting back to the topic of what candle takes precedent. so, on GR absolute perfect entry but you got stopped out. so then you look back a few candles to see if there is another formation that would lead you to take the opposite side of the original trade. on GR, a hammer at 11:10. so, the hammer was the sign of the real trend, not the doji.
check out this article:
http://tradermike.net/2005/07/position_sizing/
your posts are so long i have to open up two windows, one that is on the comment section and the other to read the blog. this way i can comment while read, ha! hope its not too much.
some truly excellent entries, tight stops. i know it is much easier to look at the chart end of day and say short here, long here,short here but you were doing it in real time. let them winners run and stick to the plan brother. remember, we don't have to make a killing, just 500, 500, 500,500 slow and steady. i have to keep reminding myself. i want to make losses up in one trade constantly.
later
Thanks for pointing that out on DE - it was a short. I am still in the habit of thinking entry == buy. I have probably done that a lot across past posts.
ReplyDeleteTO be honest with you, I am not sure what to call that - support or resistance. I was thinking of it in terms of the general trend: support = in support of the general trend, and resistance = resisting the general trend. But as I was writing the post yesterday I started trying to be more specific.
I suppose price support could mean keeping the price from going lower, and price resistance could be keeping the price from going higher - but in that case I wanted the price to go lower =).
That is funky about the volume bar on the Q's.
Re. APA: I really don't know, but I tend to rely on the immediate term. The 9:45 should of been my exit signal, ideally placing a buy limit on the doji close, at least that is what I think now looking at it.
Looking at it now, my thinking is something like - the 9:40 doji went down, but enough buyers came in to retrace. The immediate volume is higher and a guy needs to remember that that is not all sell volume (even though it is red, which is what I tend to consider) - that is buyers coming in to push the price back. Same thing on the top of the curve. I went long with the stop on the prior close. and I got stopped. As it retraced and went on up, I thought that my price point point was close enough to the prior close that I went in again. It probably would have been a better call to wait till that candle was done after trying once. The lower volume could have been a short signal.
But then - and what I was thinking in my post, the 9:35 looked stalled, and I probably would have been long on the close, especially with the EMA support.
And then there is the market.
But that is probably way too analytical. And, lol, we are talking dimes and change here. I think you are right to say give it your best and go for it. Tight stops and winners run. I think it will just start becoming more and more instinctive - perhaps in some way quantifiable - but we won't necessarily know how to quantify it, à la FNG's freakin awesome trading.
Not sure if you saw this, but I linked to a video a couple of weekends back re. emotions and decision making (http://daytradingfool.blogspot.com/2010/04/dopamine-neurons-metacognition-and.html). Fascinating - and yes, he does get around to mentioning the stock market.
Good read on the position sizing. I think right now though it is about me feeling ok about getting stopped 20 times in a row. I think I stopped something like 10 times in a row on Friday, before the TNA debacle. I expect this to get better, and as it does, I will size up.... and MAKE THE BIG BUCKS!
Heh.