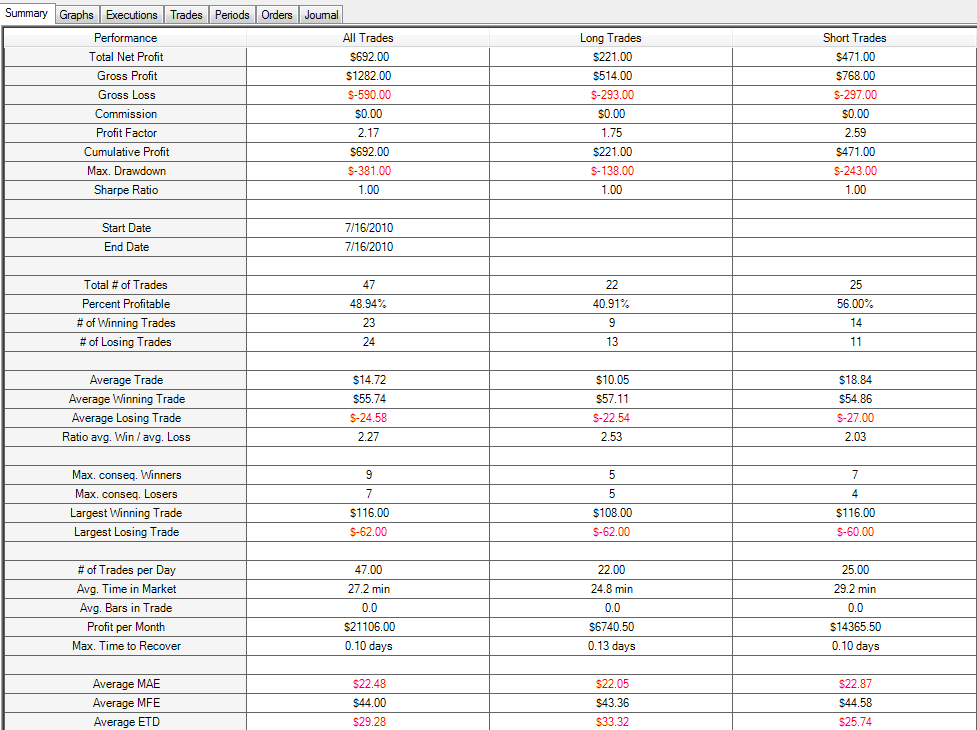
"An expert is a man who has made all the mistakes which can be made, in a narrow field."

- Niels Henrik David Bohr

Friday, July 16, 2010

End of Day Journal (7-16-2010)

Summary:


Finished positive at +$692. 200 share lots and all on paper:


A word or two about the trades. I watched the Q's and traded the ETF's today, bulls and bears: TNA, QLD, TZA, EDZ. Red arrows mark short entries or long exits, green arrows mark long entries or short exits, the red diamonds are stops (Q's):


I saw market weakness and had a short bias for the morning. The way the 7:35 was shaping up looked fantastic. I can't say that I would of called it any other way, but looking at the 15 gives me some pause. In fact, after the stop, I went long - and the wait on that exit was a bad read. The 15 minute is pretty clear on the exit, and I should have been looking for the chance to get out with all that indecision floating around. The 15 minute spinning top on the 8:00 called the short and I was a little late. I got stopped on a few of the ETF's but came right back in. Timing is so crucial, being late to the game lends itself to being stopped out too quickly.

The short on the 8:35  was looking good. I had some pause on the 9:05 rebound, but I stayed in and doubled up as it continued. Heh. It was one of those 'What would Scott do?' moments; we can debate the wisdom of that I suppose.

I exited on the 9:50, losing most of the profit, and right when things started to turn around. Unbelievable. Earlier I was thinking that the 9:05 should of been the signal to get out - a new low that finished green. But - perhaps the stronger signal was the new lows on lower volumes; specifically the 9:00, 10:05, and the 12:25. Could of pulled reverses on those, looking for a quick profit and waiting for the market to return to trend/bias. Much more in and out - but I think a more consistent policy overall (at least for today). I like it.

Ok - well this pretty  much sums it up till I get back from Costa Rica. I may have time for an early morning session on Monday, but not planning on it, depends how the weekend goes. It is nice to finish strong.

Details:


EDZ (+$148):


QLD (+$212):


TNA: you will notice that I got stopped out more on TZA and TNA. And on the 12:15 short, I actually set the stop way up on the prior candle high to avoid the stop - bad policy; I was negative 50 ticks at one point lol. Entry timing is critical. (+$209):


TZA ($123):


Extra charts:

I recorded buy/sell volume again today and I started trying to find some patterns after the market closed. Mixed bag. Funky strange beast, I think it would be wrong to read too much into this, but I still want to give it a little more time. It seems that the one side can be outnumbering the other side by a significant margin but the candle will still move in the opposite direction. The chart below with the Q's is a good example. I marked two doji's and a pretty solid red candle. Re. the doji's I would at least expect to be able to have some suggestion as to what was coming next via the buy sell. The first doji has more buy then sell - yet it was a classic short signal. The next doji shows quite a bit more selling than buying - and this worked out for the immediate future (i.e., the end of the doji would have been a good short for one silly low volume candle). The last marker shows a solid red candle with quite a bit more buy volume than sell volume. Again, this was a precursor, but only for the immediate future:

Q's:


Note: the first volume candle is invalid - the volume is about right, but I logged on sometime during the candle formation so it should be discarded. It would be kind of cool to see how the candles prior to that were playing out.

Again - I am beginning to wonder about the value of static historical charts (I corrected yesterday's entry). It seems to me that the real value comes from how the candle unfolds, or the speed with which the candle moves up/down. I don't know, just a hunch.

Fozzking posted this yesterday - we probably have the same readers, but thought I would pass on a good thing.

Thursday, July 15, 2010

End of Day Journal (7-15-2010)

Summary:

Paper traded today and ended the day positive at +$368. 200 share lots and scaled up on the winners... and a few that didn't work out.

What a difference a day makes. I think I have been suffering the effects of cumulative sleep deprivation. My body is in some awful pattern of 4 to 5 hours a night, for something like the better part of the last 7 years. I hate it, but there doesn't seem to be much I can do about it (caffeine intake is down over 90% for the last 5 weeks with no results). I generally try to sneak a nap in during the afternoon, but I haven't scored very well on that front over the last several weeks. I came away with a 2.5 hour nap the other day and 7 hours of sleep last night. I woke up refreshed this morning for the first time in what has seemed like weeks. I felt right on the edge today - much better, but if I pushed it I could feel my body ready to fall back over into exhaustion.

Anyhoo - this made such a difference in the mental attitude. That and I wonder if I have reached the end: coming to grips with the idea that trading is a high performance art, requiring mental agility and a lot of screen time. I am willing to wait now, expecting it to take awhile, and content to paper trade until it just clicks. Stocks can only do a a few things: go up, go down, or go sideways; only so many ways for this to happen. I am planning on getting familiar with most of them before placing any more money on the line.

What's familiar? A consistent paper profit. A sense of comfort and confidence in what I am doing.

What's the plan? I am going to focus on the favorites, TI's high flyin' fast movin' screener, and the ETF's. Big basket -probably stick with the ETF's and favorites for the first few weeks. Entries when it looks like things are going to move, and exits when it looks like they stopped moving, after a big move, or when I would be crazy not to.

I expect to get better at this - meaning I will allow myself the freedom to not do as well as Scott does, yet keep his trades as the standard.... and daily inspiration.

I am still messing around with the TICKs and buy/sell volume; but I want to simplify as much as possible. I feel like the TICKs have been pretty helpful for market feel, but buy/sell volume shows no consistency yet at all. We shall see.

Also - I plan on watching real momo moves over and over again, e.g., today's EOD rally that I recorded. I want to burn these into my brain - distinguishing between noise and the big moves is what all this practice will be about. I want to get better and better at 'sensing' that things are about to change.

Silly me. What made me so special? Why did I think I could get this faster or easier than anyone else? Pfft.

That is the market - naive beginner's luck reeling the innocent in to suck them dry. Familiar to everyone who has tried trading. I plan on sticking around awhile...

Two years - if I don't have 'it' by then, then I will move onto something else. And still have my money.

Sweet tune. 

I am going to post the recorded charts for the record - I want to save the buy/sell volume for future reference.  Some of the charts will have trades, but I am not posting all the trades tonight; pretty much the same old thing I have been doing - seeing momo where there is momo - and unfortunately - where there is chop. I plan on processing/analyzing my trades more while I am in the moment, taken in the context of the entire market moment.

I am beginning to wonder about the value of static historical charts.

Details:


ABX:

BP:

BTU:

CLF:

EDZ:

GG:

LVS:

PCX:

QLD:

RIG:

TNA:

Wednesday, July 14, 2010

End of Day Journal (7-14-2010)

Summary:

I spent the day paper trading and fell into what has pretty much become the routine: great entries, lousy exits. for example: I came in short on ABX on the 8:30, doubled up, then out on the 8:45. This was a good trade - in fact all the entries mirrored Scott's, but he held until it really turned. I got out and tried to go long and ended up losing half the profit on the subsequent stop.

I had several trades like this - mirrored Scott's entries on TNA and QLD but then I was shaken out and tried the reversals.

What does this mean? I don't know. It has to be good that I am spotting the entries; it would seem a simple matter of reversing the approach and nailing the exits. Pfft.

Scott (I am going to call him my mentor, whether he knows it or not =) ) sets an incredibly high standard; and as he explained in his reply comment today - an incredibly simple standard. High standards are great, and I personally have always set high standards for myself. But with this trading thing, I am not so sure. Scott has years of experience to draw from; I don't. I compare my trades to his (setting the standard) and it is incredibly discouraging.

And this is paper trading. Good grief. It is beating me up and turning me inside out. I am exhausted; worn out and ready to quit. This can't be healthy.

Ok - on the bright side - I can keep paper trading till I am blue in the face. On one hand I should be grateful that there is such a psychological connection, perhaps all this practice will make the transition to live trading that much easier. And I have the freedom to practice indefinitely into the future. Of course, the sooner this works the better, but financially I am set to go. Those are all things to be grateful for. I don't need to get this overnight, or in 2 weeks, or in 1 year; as long as I can hang in there. The problem is, I wanted this to happen yesterday already.

This is turning into a pep rally. It is hard for me to understand the emotional/mental connection to this trading thing, but days like today are devastating. Go figure. How to make this dis-connect and let this thing happen. Perhaps a break is in order.

But - every day of practice is another day of experience. Charlie D. said that it takes about 4 to 5 thousand trades before a trader as experienced the vast majority of the situations that the market has to offer. Costa Rica might be the break I need to get back on track, but until then I plan on slogging thru it all via paper.

Funny - I have had some fantastic days. I just can't seem to keep it up. If I could somehow harness and corral those good trades.

I am tempted to put the 30 tick profit target on. Scott says I shouldn't. As a compromise, I am going to paper trade the way I have been, trying to learn and react to the market, and use NT's shadow strategy feature to try out the $0.30 profit target. This will give me a comparison and perhaps a benchmark.

The mind game is incredible.

Sleep well. Trade well.

Tuesday, July 13, 2010

End of Day Journal (7-13-2010)

Summary:


Woke up early, got some exercise... started up the charts and was so tired went back to bed for a couple of hours. I ended up doing some paper trading but nothing to brag about.

Spent the rest of the day trying to get caught up with some book work and Costa Rica prep, and still at it. Anyhoo...

Found some some great new artists to keep me company with the bookwork:

Bon Iver

The Tallest Man on Earth

Up early for a round of Disc Golf and then I plan on paper trading. On a side note, that new visual on the buy/sell volume did not work out at all. I am probably going to scratch the whole idea, but for now I will keep recording the day's activity.

Monday, July 12, 2010

Summary:


Another day spent watching the markets unfold. I also paid attention to the live buy/sell volume on a couple of stocks - previously I had only reviewed them EOD. The day was also broken up with picking up my wife from the airport.

I have to say again, this is a new experience for me. As I mentioned to Fozz after market close today, I have only ever studied static historical charts, attempting to identify patterns before the big moves - or been actively engaged in and trying to profit from the events, via live/paper trading. Watching/listening to the market like this is lending itself to some objective perspective: I am going to call it a much sharper focus and even some market move anticipation; sometimes I feel like the market is going to do something. This is all new to me - and I am starting to think that this might be where master traders find themselves. If so, letting this 'feeling' develop and mature so it is familiar/strong enough to withstand the emotional live (and in my case even paper) trading gamut is probably the way to go.

Heh -  always the optimist, clinging to the idea of a turning point - but I like to call this progress. Time will tell. It is definitely different from any other approach/attitude I have had thus far.

I am going to post the charts and notes for the sake of posterity and my own personal later review; they are a little cumbersome. The most interesting one is the ABX which had a strange volume signal on the 11:20. Might be a misprint. Still not sure about this indicator - I like the concept (and it doesn't lag), but it looks like some big moves happen independent of the respective bid/ask trading volume. I found a better version of the buy/sell volume on the NT forums which should give a better visual and perhaps a better sense of market bias.

Also of interest, I ran across an article this morning (somewhere on my iGoogle page) about the dying language of trading hand signals. There is a guy documenting all of this over at http://tradingpithistory.com/.

Anyhoo - he found a 1989 copy of a trading lesson presented by Charlie D (the 'Michael Jordan of the Pit') and posted it on YouTube. I started watching it during some of the more boring market moments today and couldn't quit. Fascinating - trading venues have changed, but the basics of making money haven't: add to your winners and cut your losses. He spends about 70% of the video talking about pit position and how to get your orders filled (BE LOUD), but I found it worth the sit thru. Timeless: 'I have known successful doctors, lawyers, and teachers; they all at a certain point in time want to give it up and do something else... I don't know anybody that is good at commodities trading that ever gave it up.' Best business in the world.

Details:


Friday, July 9, 2010

End of Day Journal (7-9-2010)

Summary:


Another day spent watching the markets unfold. Primarily this consisted of the TICK, TICKQ, and the Q's. I charted the 5 minute and then the 1 minute Ticks against the 5 minute Q. I made notes on the 5 minute version throughout the day:


Yes  - a lot of stuff on the charts. The advantage that I see with the one minute Ticks is that it is much easier to see overall market sentiment. For example, just looking at the 5 minute today, the fact that the market was bullish for most of the day is not quite so easy to pick out - the 5 minute candle dips, perhaps shooting right back up, but for the casual observer, it could have been negative for most of the 5 minutes, without him/her ever being the wiser. The one minute is more reflective of where all the action is.

It is a little hard to tell on the chart above as I was trying to squeeze the entire day in, so here is a condensed version:


(On all of these, the navy blue line marks the '0'; the lighter blue line marks the 'average' levels; 600 and -600 on the TICK, and 400 and -400 on the TICKQ. The 600 level is more or less supported from various internet sources; I threw the 400 line on the TICKQs yesterday just because it looked about right.)

The Ticks rarely got down to the average low level at all today, and you can see in the 1 minute, that they did not hang around negative much at all.

Interestingly, a mixed bag on the signals. Some of the extremes or new high/lows presented good fade opportunities - in fact nearly all did if you were very quick, but it would have been tough betting against the bulls.

Also - All the bullish side action lends a lot of support to the 11:55 market breakthru.

Another thing I did today was record the buy/sell volume on several stocks. I had one chart set up especially for the Q's:


I got in a little late on this chart, hence no buy/sell until 8. It is clear to see that the trade at ask volume far outweighs the trade at bid volume - very bullish. This may offer some indication of when to get out of a trade.

Interestingly enough, the buy/sell volume showed some interesting action later in the day. I just took snapshots for later review:


Of interest here are the far right candles - notice how many trades are filling at ask, the first two are of the same candle, the next two are of a candle ten minutes later, and the last is end of day. Strong buying, but the Q's dropped like a rock; it didn't keep up though.

Based on that sequence, the buy/sell volume looks like a strong indicator. However, I recorded several additional stocks as well, and kind of a mixed bag. I will post BP first - Scott traded it and I marked his entries. You can judge for yourself, but I am reading bullish on the buy/sell volume on BP for most of the day; it does start evening out when Scott shorts, but I am not sure that I would of read it well enough to call it - perhaps with the doji at the top printing. That might be key - buy/sell volume within candle context.


(Of course, Scott just nailed it.)


I actually tried a little experiment - limiting the view to only the buy/sell volume, I tried to determine what the price was doing (as checked by the candles): bullish or bearish sentiment. I got surprisingly close on all of these. I may post these over the weekend.

Well - I am feeling braver. I think this has been a healthy exercise - watching and trying to learn from the market without even paper trading; it puts me in a completely different place mentally: pure focus. I wonder if this is where I should be while I am actually trading? I think so.

The plan is to do this another day; then I am scheduled for a paper trading conference - going to spend half the morning comparing observations with Eric on Tuesday. I hadn't been doing the affirmations - strange how quickly it can come to seem routine and mundane. I picked them up again today and plan on keeping at it. I think the affirmations probably play a much larger role than I ever acknowledged.

Have a great weekend.

Thursday, July 8, 2010

End of Day Journal (7-8-2010)

Summary:

Whew - much more relaxed today.

Heh - probably because I didn't do anything. =)

I decided to kick back and just watch the market. Tarigal and Fozz turned me onto the TICK, a pretty cool idea. Basically it records the difference between stocks trading at bid and stocks trading at ask. If the number is positive, say 500, then 500 more stocks are trading at ask (buyers gobbling them up) then are trading at bid. A market sentiment indicator. I don't have access to the awesome Real Tick/Lightspeed new high/low ticker any longer, but I almost think this can serve as a proxy.

Another cool thing I learned today from Eric over at the Stock Junkie is that I can set the Trade Ideas alert windows up to play a sound when they trigger - cool stuff, and something that I have been wanting for awhile. Trade Ideas 'groups' the data send, rather than each new high/low coming thru right after it happens, it seems to send them thru every 1/2 second or so (if there are any). Not quite the Lightspeed feel, but it is something, the audio will help to confirm market momo, without the visual.

So - I basically spent the day focused on the markets and the TICK action. A different experience for me - able to focus and just try to listen to what the market was saying. I think this is good and may actually pay off - if I can get used to adopting that mindset, perhaps I can bring it into my trading. I took notes as the day unfolded, points of interest and things that caught my attention:


Looking at it now - it seems that when the TICK hits/touches LOD and comes back positive, it is an especially good rally signal. I don't see anything on the short side yet. But it is interesting to watch it unfold like this.

After market I decided to pull up the NASDAQ version of TICK and make some comparisons. There is quite a bit of info readily available on the TICK, not so much so on the NASDAQ version (as in top google search results) . Just looking at the one minute on the NASDAQ version, it appears that it is a little more 'trendy':


One more thing I plan on watching tomorrow: NT has a buy/sell volume indicator that I was messing around with, basically - an individual stock version of the TICK It is non-historical, so I have to record it during the day to observe it. I think I will set up several charts tomorrow to record how some stocks unfold, but here is what I grabbed from BP today:


Slightly different interpretation, but the idea is the same: who is capitulating.

Anyhoo - interesting and fun stuff. Tomorrow more of the same.

Rest well, THINK well, and trade well.

Wednesday, July 7, 2010

End of Day Journal (7-7-2010)

Summary:

Suffice to say that today was perfectly awful trading wise. I don't feel like posting details or ruminating. The day pretty much followed the same track I have been taking lately.

What is absolutely crazy is the emotional attachment, even while paper trading. The thought that kept creeping into my head was that the entire market was working against me... AND I WAS PAPER TRADING. I wasn't even a participating. Is that paranoid enough for you? I wonder if I am ruining this entire experience for myself.

So, not a lot of trade talk going on; I need a break. I am not so sure that I need or can work any harder at this... my gut is saying that I shouldn't.

After the session was over I went out and got a massage and did some of the family Costco shopping. Tonight it is grilled salmon and a movie with the kids. Truth be told, I feel better already.

And, I/we get the big break here in a little under two weeks. We are taking the family down to Costa Rica for a couple of weeks. I had hoped to have this trading thing well on the way by then. In fact, that might be what is adding to all the performance pressure. I officially give it up today. Maybe I will sleep better tonight.

Trade well.

Tuesday, July 6, 2010

End of Day Journal (7-6-2010)

Summary:


Traded 200 share lots today and down $684.73 for the day:


Pfft.. what a day. If it would have been 500 shares, the day would rank right up there with some of the worst.

I traded a little differently today - entries came in with a stop and a profit target (50 and 100 ticks respectively). I then adjusted both to where I thought they should be visually. Thinking about it now, I did move the profit quite a bit as the stock was moving. Probably not such a good idea.


I am having an extremely difficult time with my exits - the usual. If a move got big, I was jumping out before it could get bigger. Then time and time again I had good direction and scaled in, it continued moving (>30 ticks), I usually forced myself to be patient and got stopped. The late afternoon was completely unreadable for me.


CLF looks like it is full of crazy man trades. It is. I came in short on the very first entry - and it would of held if the stop would have been set correctly, for a good $3 all day move. But - the proper stop place was some 40 ticks and I opted for 'immediate' stop on the prior candle close. Hindsight is 20/20.

What was I thinking on CLF? Most of the sequences were entries, direction and scale, or entries stops and reversals. I look at it, and I post it, and something inside of me wants to justify all the trades. The bad part about this is that often the trades had direction and in my mind that justifies the entry/re-entry. I am pretty much convinced that I need to break away from that kind of a mindset; if I even attempt to justify the trades I am setting myself up to do them again.

In line with all of this, and perhaps contributing to all the ins and outs on CLF today: I consider myself above par in a lot of areas - not the best, but comfortably in the top 1/4 percentile. Most things that I try to do I am fairly successful at; I expect the same thing is true for the vast majority of people that attempt to day trade. I think this lends itself to a certain flair - for me it becomes: 'Hey - you never know what can happen - why not take the chance? I usually get it right.' So - instead of taking only the high probability entries today, I took them all.

Turns out the stock market is a great reality check. Catching myself in this thought pattern should be a definite warning sign to slow down or quit trading. I don't know how many times I told myself - 'Try it - you never know.' (Again - this is complicated by the fact that something over 50% of my entries had good direction >20 ticks.)


Looking at the charts end of day, it is very easy to pick out the good entries. Should it be so much harder during the session? Technically - it should have been just as easy to have a $687 profit as it was to have a $687 loss.

But it is a lot harder to see these patterns in real time, and it is a lot easier to lose. Why? Because I make them harder to see and I make it easier to lose. The battle is all in my head. Nothing more. 

This has to be remedied. I need two things: CONFIDENCE. In my ability to read the markets and to consistently profit from my edge; and evidently, ANOTHER source of love and acceptance (more on this later).

I was trying to explain this to my wife this afternoon - this idea that the battle is all in my head - how it is not so much about being right or wrong on a trade, it is about what happens after I am right or wrong. It didn't come out so well, but the more I do this, the clearer it personally becomes. For example - I was up 40 some ticks on the last trade of the day (CLF entry at 12:45) on 1000 shares after the scale. The only thing keeping me from realizing the profit was me - I could of exited at any time, but I exited at the top of the wick on the  12:55, for a little better than break even. The exit was about what was going on in my brain, not about being right or wrong. This happened all day today.


Time to slow down. Time to get back on plan. Time to paper trade.

The plan is the afore mentioned entry strategies - I was doing fine with these on paper. I venture out to trade live and fall to pieces...

And on another note - Tarigal and I had a great discussion today a couple of hours after market close, stemming from an entry on Trader Psyches and Tarigal's response to it.

Why do people say they want to be a day trader? Or, more perhaps more pertinent to our discussion, what is the motive underlying the motive?

Love and acceptance?

At first blush, I was a little hesitant. I have thought about this before - a good trader needs to give himself the freedom to fail, and the freedom to succeed; I have found that this freedom - for any area in life - can only come from some outside source of love and acceptance; not in what I can or can't do, but what someone says about me outside of myself. I had convinced myself that I was above/beyond this when it comes to trading - I have other sources of love and acceptance.

But... thinking about it some more, I am not so sure. This trading thing is a big deal to me, in terms of future career path, work environment, and lifestyle.  I feel that a lot is riding on how successful I am at this - probably the way it is for a lot of new traders. And look at my level of commitment: this blog (the length of this entry - lol), my weekends, my holidays, reading nothing but trading books and blogs, my lack of sleep... in short, my thinking of trading 24/7. Don't ask me about trading if you just want to make quick small talk... my poor wife knows more about trading than she ever wanted to know.

Again, I thought that I was concerned with smaller things (career path, lifestyle, etc.) - but I am not sure that smaller things would consume so much of my time; trading has become something more... On some level, I am beginning to think that this trading thing is a pre-occupation, a mis-identification of my source for love and acceptance.

Think about it for a bit. Everyone recognizes that a lot of people look to their vocations as a means of much more than income; it can become/is a source of identification; of knowing who we are, how to relate to people, and we should expect people to relate to us - or how people should love and accept us. And then there is trading...

The trading game is completely psychological, mental ability; whatever is in my head is manifested on the charts at the click of a button. In no other vocation is this concept (i.e. mental and emotional health) so clearly linked to successful outcome. E.g., sure, it is important to me how good an engineer I am, and it makes me feel good when I complete a project well, but there is a lot of time and energy that stands between me feeling loved and accepted and a good bridge design. Only a click separates trading and results.

Professional poker may be about the only mental/psychological equivalent to trading - maybe this is why a lot of the good traders draw analogies from the poker table.

I am not sure what to do with all of this. I am thinking paper trading - getting so used to feeling like it doesn't really matter (while at the same time garnering additional chart reading skills) that when I start trading live I can readily find that spot in my head again. Maybe. That coupled with getting a life outside of this trading thang.

Well anyhoo... this is long enough. Details follow, the new idea section follows that.

Rest well. Trade well.

Details:


(A note on the charts: entries are always on the left side of the candle. Pink means sell, blue means buy. The exits are on the right side of the candle with the same color definition. Coming in short (pink) requires a long (blue) on the exit.)

Market action and my lines:


ABX (+$100.93):


BTU (-$37.48):


CLF (-$203.84):


CLF - the 1 minute against the 5 minute to show direction on trades and what I ended up missing. Not quite as crazy as it looks...


CTRP: The first stop was a killer - I didn't check the distance and went by the visual.  Problem is it had already dropped $7 (-$306.01):


CTRP - the 1 minute against the 5 minute, to show direction on the trades and what I gave up:


GG (+$31.62):


LVS (-$195.52):


V (-$73.45):


Ideas:


So - I am adding a new section to each entry - I am going to call it the Ideas section. Going to take one stock that I traded and pick out the most efficient entries and the most realistic entries. Get my brain familiar with the patterns 

I took another look at the CLF chart and picked entries (beginning of line marks the entry bar):


Some 11 short (red lines, left side of line in entry bar) entries and some 9 long (blue lines, left side of line in entry bar) entries. All require perfect timing and some kind of uncanny trading sense. Impossible for maybe anyone but Scott, but there they are. (I missed the 7:40 doji, so add another short to the list.)

Here is how I traded it: 


I hit all the good spots and then some.

Now - highlighting all of the entries that gave some type of real time hint at what was to come; e.g., long wicks, long candles, resistance/support lines, etc. I highlighted the respective entries and the potential signal:


Nothing new here, I just want to re-enforce these patterns in my mind.