"An expert is a man who has made all the mistakes which can be made, in a narrow field."

- Niels Henrik David Bohr
Showing posts with label Al Brooks. Show all posts

Wednesday, December 1, 2010

End of Day Journal (12-1-2010)

Summary:

Live trading on 50 shares today:


I was at the screens all day, but didn't spot any opportunities till rather late in the day. Perhaps I am maturing as a trader...

There were opportunities this morning, just none that I spotted. NFLX signaled short at 10:25, but the spread was so crazy and the action so quick I decided to stay out. FFIV came up on the 12:30 but as sporadic as my success has been with that stock I opted to stay out.

Anyhoo - the trade on NFLX stopped out immediately, FFIV  sputtered around until it came up with some direction, and AAPL had some honest $0.50 on it, but I opted to stay in and got stopped.

I delayed the blog entry today because I am puzzling over what to make of the range charts. I cannot for the life of me read anything out of them today. When it comes down to it, the information presented in a single bar is very limited, again, because the bars are lacking the time element. There are not very many different shapes the bars can take. The body always has to be on one end of the bar or the other. From what I gathered from Brooks, he started his journey by coming up with a profit target, and then examining price action just prior to any move large enough to hit his target. The problem with doing this on range bars is that the patterns are very limited.

I am posting the charts with what I have for now, but likely will continue to wrestle with them for a bit tonight. If I come up with anything I will post.

Trade well.


Details:

AAPL


FFIV


NFLX

Tuesday, November 30, 2010

End of Day Journal (11-30-2010)

Summary:

Live trading on 50 shares:


Today was wracked by some frustration; set off mostly by the fact that I was at the bottom of the $4 craziness on NFLX and I bailed early. Why did I bail? Because I had been reading up on Al Brooks all morning and kept glancing at the 5 minute chart... pfft.

I have decided that I simply cannot do that any more. Mr. Brooks has a lot of good info and I will keep reading it, but I am going to stick to trying to apply the general concepts to range charts for now. This is working and I need to stick with it.

On that note - I decided to look at the end of day range charts from the 'perfect trade' perspective: I am going to review and analyze the charts to look for clues as to successful and failed entries.

Brooks mentions something along the lines of 'focusing on the details because it is often the smallest details that lead to the best trades'- and he is detailed. Incredibly so. This has inspired me to prod and poke the range charts for whatever they can afford to yield. Reading over his information has highlighted the differences between 5 minute candles and range bars. Time adds an entirely different dimension (pfft...).

When I started reviewing today's range charts, I realized that all I have to look at are price and volume - LOL! My first thought was that there was no way that I could get the information from range bars that Brooks reads from 5 minute candles. But then I realized that he had to start somewhere as well; at one time he may have thought it impossible to find what he needed in 5 minute candles. This might be a stretch - but if I wanted to keep things as simple as possible - time may be an unnecessary complication. But... heh, what do I know? I am willing to give it a go for a couple of weeks to see what I can find.

In fact, I did find several things to help with tomorrow's entries: not trading against the prior 45 bar; avoiding non-trending stocks (realizing that I will likely not get start of trend entries often), and a re-enforcement of the 'stutter volume' on big momo moves. Feel free to call out anything you might notice as well.

Too tired to review/edit this post, so please forgive the grammatical/spelling errors. Will try to get around to it tomorrow.

Trade well.

Details:


NFLX:


Check out the volume on the HOD and the subsequent swing low (below).This happens over and over again on the momo moves. I didn't trade the top or the bottom because it was out of plan - and right now I am all about staying in plan. But it sure was tempting...


 CMG


 Here is the swing on CMG; not as clean on the top and the bottom was indistinguishable.


FSLR


 AMZN


TNA


I mentioned on this chart that I thought a lower range would produce the volume stutter on the highs, but I checked it down to a range 10 and it did not.

Monday, November 29, 2010

End of Day Journal (11-29-2010)

Summary:

Live trading on 50 shares:


Rather disappointing day, first day live again, and after a great week of paper trades last week, not much happened today. I only had 6 entries, with 4 of those initiated before the lunch hour. All of them showed profit before getting stopped except for AMZN. I wanted to call today some pretty funky price action, but every day is funky.

Last trade on NFLX saw > +$1.30, but I had some internet connectivity issues and NT got gummed up on the reconnection so I missed the HOD. Hard telling if I would of exited, but I didn't have the opportunity.

I added a new section - I would like to start reviewing price action on the 5 minute candles. This first attempt is very noobish, but taking a stab at it. Crazy Monday schedule kept me busy all afternoon and I am too tired to look at all three charts tonight.

Trade well

Details:


AAPL


AMZN


NFLX


5-Minute Review


I am going to try and start analyzing price action on the 5 minute candles (ala Brooks). Again, going to continue to trade on the outlined approach, but the more I read about Brooks the mroe I am convinced that that is the trading/analytical style I want to develop. Typical Monday schedule so I didn't get very far on this. And it is completely noobie, I don't have the book yet and am just using what I have gleaned thus far. The hope is to eventually make it my own.

AAPL


AMZN


NFLX

Tuesday, November 23, 2010

End of Day Journal (11-23-2010)

Summary:

Paper trading on 50 share lots today:


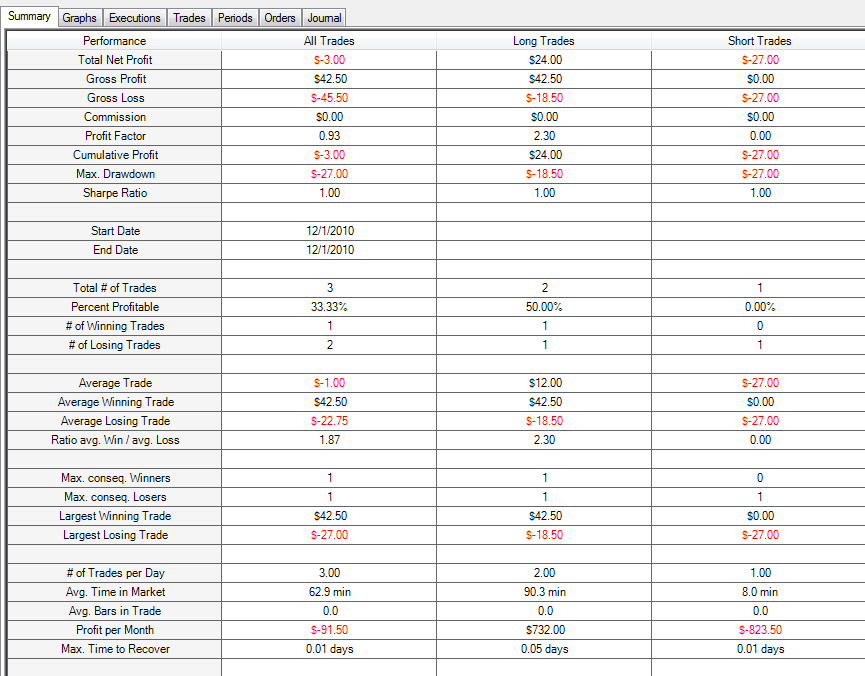
A great morning and a losing afternoon...

And I was relatively surprised to find out at EOD review that I was trading out of plan this afternoon. I traded several corrective waves expecting in the primary trend direction (expecting continuation)... For some reason I completely forgot to draw waves during the afternoon session. The lines would of kept me out of a lot of stops.

Thinking back over the day I want to attribute the afternoon trading to a couple of things. First - I saw plenty of long opportunities and my approach was not allowing me to go long. Rather than carefully considering what was happening I jumped in on which ever stock was allowing me trade - by only looking at the indicator (price crossing the short MA with color). This cost me 1/3 of the day's profits.

Anyhoo - I had 3 stocks with $2/share gains at one point today. It began to get very difficult when they started coming back. I managed to get decent exits on them, but the emotions were just under the surface. Funky.

I am reading and finding out a lot about price action (via Al Brooks) and wave patterns. I am sorely tempted to switch up my system again.... The bane and downfall of new traders - an inability to stick with a decent and workable plan?

The thing is - today I missed several opportunities, and I hated it (the short opportunity on both NFLX's  and CRM's crazy morning runs and long opportunities on them and both and CMG). I had to sit on my hands. In some ways I think this is actually good for me, i.e., forcing me to be disciplined and patient. But at the same time I seem to be biding my time and trading 'any' opportunity that my 'indicator' (price over the MA) says I am allowed to; kind of like a blind reliance on the system rather than on myself.

Input sought, welcome, and appreciated.

Anyhoo - I think for now I will stick with the plan (and try to trade in the plan). I think it has the potential to be very profitable. But I plan to keep studying price action (Al Brooks does a great job and should have a new edition of his book coming out (thanks to Fozz for that link)) and wave patterns.

Price action is fascinating. Honestly, my approach to the charts has been mostly about taking/making a guess - and calling it intuitive, I have had a very hard time describing where/when/who/what. I would see people write about 'early shorts are setting stops here' and wonder what in the world they were talking about. I would try to puzzle it out but did nothing other than confuse myself. Is this what I would do? How do I know someone else is doing this? Why are there early longs/shorts if they know they are early? How do I know that they are early and right rather than early and wrong? Etc., etc.  From the little that I have read, Al manages to do a great job of describing the story behind the price. The reviews that I have read would suggest that the book is not very well written - and he himself readily admits as much. I am looking forward to the second edition.

Trade well!

Details:

I siwtched up the way that I draw the waves and am now placing the lines right on the respective highs and lows. Again, I drew sets on the morning's entries, but somehow forgot to on the afternoons. When the pattern failed to materialize (usually the 5th wave) I assumed something other than trend was going on and waited for the next breakout for the first leg. Amazing how this works out.

AAPL


 AMZN


 CF


CMG


FFIV


NFLX


UPRO