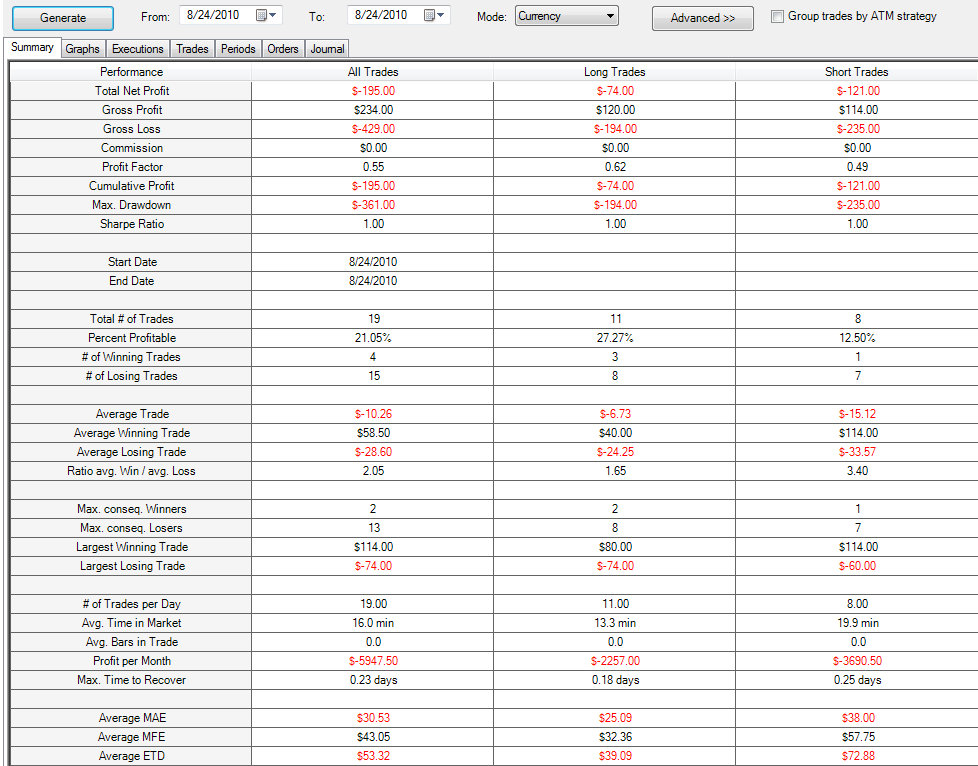
"An expert is a man who has made all the mistakes which can be made, in a narrow field."

- Niels Henrik David Bohr

Tuesday, August 31, 2010

End of Day Journal (8-31-2010)

Summary:

Finished the day at +$45 (paper trading 200 share lots of TNA):


Nothing exciting on the profit charts. PnL comes out to about $0.22 per share.

The day was somewhat boring - but profitable! I traded 100% within the plan - there is not a lot of room for discretion which makes it much simpler. Discretion does come into play with respect to when the 15 minute trend is changing (e.g., on the decision to go short on the 2:20) - but I think the 5 minute will show clues as to which direction things are headed (in the case of the 2:20 it was the 2:15 failing to pierce the high of the 2:10).

A lot of money was left on the table, especially in terms of maximum available profit, but I think that I would be wise to forget about that for the time being - I need a safe place to build confidence and a foundation for a new belief system. Speaking of which, I think I need several days like this to help reinforce the ideas Douglas talks about. In retrospect, I think the reason Mr. Douglas' book resonated so well after I had first read it was because I was coming off of 7 days of positive trades - this offered an open and positive mindset. Losing for the next two days took its toll, and losing for the rest of the week knocked me silly. It is extremely difficult to pay attention to what I want to believe when everything around me is screaming the exact opposite.

Hence Mr. Douglas' trading exercise - and the importance of using a simple and easily defined edge.

All that being said, I didn't have the best executions. I didn't bring the stop on the long 11:20 long position as I should have, I hesitated on the 2:20 short, and I wasn't paying attention on the 2:25 exit signal (longest 15 min red bar, decreasing volume on the 5 minute). This cost me about $0.30, which, with all else being equal, would of more than doubled the EOD return.

Trade well.

Details:

Monday, August 30, 2010

End of day journal (8-30-2010) (Trading in the Zone Part 5)

I didn't much accomplished strategy wise this weekend. It felt overwhelming - I was tired and every time I sat down to try and figure something out, nothing seemed to click. It is easy for me to venture down the slippery slope of trying to make my edge/system 'full proof', finagling the details and rules in an attempt to catch everything. Exhausting.

That is the engineer in me coming out. And that is me denying the true nature of the market.

Fozzking posted a good read over on his blog that helped to point me in the right direction this morning. An interesting quote:

"...everyone I have spoken to that has read ‘Trading in the Zone’ raves about it. Yet, I only know of one person, in the many hundreds that I have spoken to, that has actually completed the Trading Exercise on pages 189-201 in the book."

Yipper. That is me. I made an effort last week, but I think I lost sight of the true nature and goals of the exercise. Fozz pointed out:

"This excercise is not about system development and it is not a test of your analytical abilities."

And in the next paragraph:


"In fact, the variables you choose can even be considered mediocre by most traders' standards, because what you are going to learn from doing this excercise is not dependent upon whether you actually make money. If you consider this exercise an educational expense, it will cut down on the amount of time and effort you might otherwise expend trying to find the most profitable edges." (Page 190, emphasis added.)

I think my 'edge' was simply too complicated (probably because I tried to make it fit every situation - as fozz also pointed out today - 'We just need to be comfortable with the fact that we are going to miss some big moves.') This had me focusing on profit rather than the goal of the exercise - which is "...to convince myself that trading is just a simple game of probabilities..." (pg. 189).

So - newly re-vamped and more trend friendly:

 My edge:
  • Only trade in the direction of the 15 minute trend (higher highs, higher lows = uptrend; lower highs, lower lows = downtrend)
  • Enter a trade when there is a retracement to prior S/R on the 5 minute candle chart. The 5 minute candle should show indecision (long wicks) and close on the direction side.
  • Stops are placed $0.03 off of the prior S/R, prior H/L or $0.11 from entry, whichever is greater.
  • If a trailing stop is triggered (15 min candles), reverse position.
  • Move the stop in step with the just completed 15 minute candle H/L.
  • Exit on the largest 15 minute candle of the day and declining volume on the 5 minute candle or when stopped.

I did a few candle by candle runs this afternoon - scroll to a random day, scroll the chart candle by candle until the 15 minute trend is identifiable, then watch and wait for the retrace and pause around prior S/R. Then move the stop down as 15 minute candles are completed. Exit when stopped or the exit criteria is met.

For the purpose of the exercise, I decided not to indicate a maximum stop or how to add.

Here is how the days came out:


Much fewer trades and not a lot of room for discretion. Good enough for me.

Trade well.

Sunday, August 29, 2010

Weekend Edition

Last week was exhausting - and it looks as if I don't have much to show for it... besides racking up more screen time.

I finished negative on Friday, somewhere in the $249 range, and was too tired to do any trade review or analysis.

After Thursday, I am having some doubts with my edge as it was last outlined. I did have a decent application on Thursday, but only having a few trades off made a significant difference on the day. I think the strategy has me jumping in and out too often, so I would like to somehow address that, perhaps by adding the EMA's back to the charts or paying more attention to the 15 minute candles (which up until now, I really haven't considered much at all).

Thanks to Fozz for pointing some of this out to me.

Hope to have something in the works before tomorrow. We will see.

Trade well.

Thursday, August 26, 2010

End of Day Journal (8-26-10)

Summary:

Un-believe-able.

Finished today at -$165 (same gig):


Comes out to -$0.825 per share.

Today I did something different on the EOD strategy application. Again, I finished the day thinking that there was no way the EOD app was going to be positive - I thought I had I traded close to the plan. First I did like I always do - cleared the charts, spread out the day in front of me, drew S/R and then flagged trade signals. It took me about 5 minutes and after an even briefer review, I knew that what I had just drawn was going to be profitable.

No way.

I decided that the entire day's data on the chart must be skewing my perspective. I erased everything, scrolled the chart back so that nothing beyond the 10:00 a.m. was visible, and took one candle at a time marking S/R and trade signals.

I want to offer a comparison between what I drew live and what I drew candle by candle (the top one is live, the bottom is candle by candle delineation):


Here's how they compare (starting from the top):

Live version:

  1. 44.28
  2. 44.08
  3. 44.02
  4. 43.98
  5. 43.90
  6. 43.83
  7. 43.79
  8. 43.70
  9. 43.58
Candle by Candle:

  1. 44.28
  2. 44.01
  3. 43.93
  4. 43.83
  5. 43.79
  6. 43.75
  7. 43.70
  8. 43.50
 And for the sake of full disclosure, indicator S/R (NT's current day OHL, and prior day OHLC) are placed at 44.32, 44.26, 44.24, 44.07, 43.50, 43.35, and 43.27. This accounts for the 44.08 in the live version (I didn't draw lines over the NT indicators on the candle by candle, but forgot to turn the lines on for the live image). The 43.58 was a new low that I didn't mark on the candle by candle but I did trade on.

Ok - all that was to convince myself: S/R == S/R, seemingly no matter how I do it. I can be consistent with this. I am guessing that I could take anyone off of the street and get them to draw something very similar within 5 minutes.

Here is how the EOD trades came out:


$1.97 per share, for a difference of $2.80 per share.

Pfft.

Where am I going wrong? Is the EOD application some hopeless fantasy?

As it turns out, I matched the EOD position 68% of the time today (calculations are at the end of this post); which amounts to missing only a couple of key decisions, nearly all of them ones that gave me pause today while trading. Keeping market context would have saved the day ('iffy' signals mean less if they go against market sentiment, and they are stronger if they go with market sentiment). But all in all, I actually nailed several of the signals. Details follow.

I took a slightly different approach and focus today, and it worked very well for most of the day. I tried to tune into the candle action for the last 30 seconds of the candle and mentally reviewed possible scenarios and how I would respond to each one. For example, if the candle was nearing support, I would envision how the candle would have to finish in order for me to reverse. At candle change I was ready to go. This allowed me to basically ignore anything in between signals and trade relatively emotion free: I became the trading machine, just clicking the button when I was told to. I did fairly well with this, except when I forgot or when I didn't consider all the rules or market context - or somehow completely missed seeing an S/R line.  

After the review, I see substantial progress today. I am almost certain that I will perhaps never get a 100% day, but I would like to see something above 90%. It is difficult to say though - missing one or two signals can make a big difference. Given the difference this can make, there may be more bias in the EOD then I have assumed. Time will tell.

Trade well.

Details:

No blow by blow today, but here are the charts:


Again, I hesitated on a couple of key decisions, meaning a late entry, improper reversal, or no trade at all. This is the only difference between the live and the EOD. Granted EOD was accomplished knowing what the charts were going to look like, but I chose what I did live today because I did not consider market sentiment in the decision. For example, the reversal on the 10:40 (long to short): the candle wicked towards the day's open and I debated the reverse. I recall thinking that the resistance had been broken once already and thought that perhaps this did not make it valid any longer. But - considering that it was the open for the day and the market was 'tentative' in reaching up to the open, it was below it - this should have been a sign of weakness. This happened again on the 11:05: the long signal was debatable, especially with the weak market sentiment.

The 13:30 short was just signal at all, which I realized after the order was filled, and I completely missed the fact that the 13:15 stopped on prior S/R. I was aware of the 15:45, but hesitated and went with the no.

A few hesitations and it changed the course of the day substantially.

I calculated the percent in plan by listing times and actions taken for both the live and EOD applications. If the actions matched over a particular time slot, the time slot received a score of 1. If they did not match, the time slot received no score. I then removed the blanks from the EOD application and divided the score by the number of actions in te EOD column:

Complete data set:


With blanks removed:

Wednesday, August 25, 2010

End of Day Journal (8-25-10)

Summary:

Finished the day at -$188.50 (same gig):


So - finished at -$0.94 per share.

Here is the EOD application:


Off by something just under $2.80 per share. Un-believe-able.

Honestly, I am sitting here trying to figure this out. To re-cap, here is how the EOD is applied:

  1. I take out the rules.
  2. I mark S/R on the Q's.
  3. I flag matching entry criteria on the Q's.
  4. I enter stop locations on TNA: the respective H/L either on the signal candle or just before.
  5. I place triggered stops on TNA.
  6. I calculate entry prices by using the opening price on the candle after the signal.
  7. I move to the next trade flag on the Q's or until TNA triggers a stop (if the stop is less than $0.10 from the entry price, I move the stop to $0.11 from entry).
  8. I use the opening price on the candle just after the signal or the stop to determine the close price.
  9. Repeat.
Seems as straight forward and as unbiased as can be. I make a special effort to 'fudge' the criteria as well - e.g., this seems close enough - I probably would of entered; even though I see the stop 2 candles away. Yet the difference between what I did when I am in the moment and invested in what is happeneing, and the EOD chart application is ridiculous.

I am telling you folks - bizzaro world.

And incredibly revealing. And incredibly encouraging!

I am go into detail on all the trades below, perhaps cumbersome, but if you want to help me figure it out give it a read. I feel that a reconciliation between what I expect and what I implement is crucial to my growth/progress as a trader. This is where its at: If I can bring these two approaches together then I feel like I can begin to hone that all powerful trader's intuition. I feel like the stark reality of what I try to do - and tell myself that I am doing - as compared to what I actually do,  is perhaps one of the most helpful and humiliating things I have tried to do. I am getting a true perspective of the problem.

And I am convinced that this is where everything comes together - the fragile emotional balance, bolstered by (eventual) confidence in my ability to apply my plan. The plan works - I can trade it on static emotionless EOD charts all day. I just need to train myself to do it while in the moment.

Emotionally... this morning was tough - I brought a lot of expectation (weakness in the market), which I managed to trade thru, but you can see the results for yourselves. Interestingly enough, I forgot about both the mantra and the trading rules after the first read, thinking that I 'knew' what they said - to my chagrin on both accounts.

Trade well!

Details:

After avoiding this type of in depth analysis for some time, I have decided to do it again. The difference between 'now' and 'then' is that now I feel I understand the true nature of the problem. Earlier I had some sense of where I needed to eventually be, but really no clue as to what my problems were - I thought it was a matter of super duper chart reading skills. Truth is, all the skill I need to have to make money I use on every EOD application. I could teach my sons how to do it in about 10 minutes and they would probably do just as well as I can.

The problem is the disconnect - as we were nearing the market close today, I thought that I had traded as well as I possibly could to the plan. I remember thinking that the EOD application was sure to lose money today. Pffft.

The way I see it, it can only be one of two things: either I am unconsciously biased with the EOD charts in front of me or I am unconsciously biased when I am emotionally invested in what is happening.

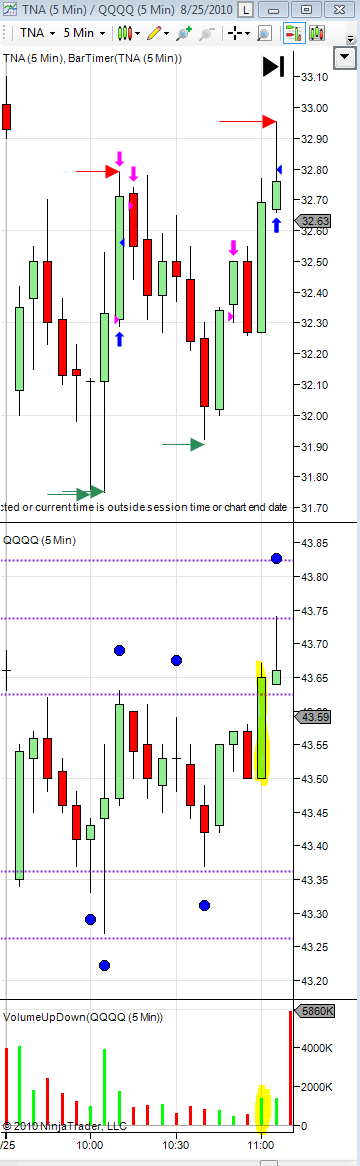
Here are the charts - you decide:


Blow-by-blow:

The first was on the 10:00 'good as it gets' doji. the candle changed and I was poised to enter the trade (long) and everything dropped like a rock (TNA dropped $0.41 in the first second), I saw this and I froze - I couldn't place the order:


Part of the hesitancy was due to the $0.34 stop and I was thinking along the lines of 'Ok - buy when it comes within $0.30 of the stop'; but I didn't stand a chance. After the volatility settled down, I looked at the candle and wasn't sure what to make of it. It was the longest bar of the day, spanning almost the entire breadth of the day's movement and I could see it doing anything (heh - go figure), so I decided to short. The plan strategy would of been to go long (long wick on the support side).


The second 'pertinent' decision came on the 10:40 'doji'. The candle formed with a longer lower wick then body and I recall thinking that this might be a good exit - but I attributed the 'might' to hesitancy and gave it a 'not sure means no' decision:


On the EOD application, I see this as a clear turn around spot and signal the trade. Josh did too. And comparing the candle to other signals that I marked, it is is well within tolerances. Why didn't I think so live? I can tell you why: I was hoping that it would continue to go down and seeing what I wanted rather than seeing what was actually happening.

The next trade was following up on this one - I added prior to my short position. Things looked good. BUT the candle had 10 seconds left - I entered and wow did the chart look different by the time the candle finished:


And of course after the candle was finished I had no place to move the stop to, so I left it where it was - for a total loss of $0.48 per share on 400 shares.

Another trade was shortly after this - big candle on the 11:00:


In the moment, I thought that the market had no clear direction, so high (exhaustion) volume didn't apply. EOD of course I see market strength for the rest of the day and don't flag an entry until the following candle. But - it could be argued that strength was apparent: Q's broke new highs on the candle. I could go either way - but I will try to consider that in the future.

I missed the next two signals (long on the 11:45 and short on the 12:15), I was short the entire time - after getting stopped out twice:


EOD I get stopped out once but get back in on the long signal. I will avoid 'getting back in' from now on, at least until I get some consistency between the live and EOD application.

I nailed the next entry. But - then I exited on the very next doji:


The exit is not on the EOD because it was not in plan: the long wick was away from S/R... strict application versus 'I don't know what the hell I am doing' application.

I did go long on the next 'doji' with long side S/R, but missed the EOD exit:


This could be a matter of EOD bias, but a trading friend of mine (Fozz) saw the short signal as a get out while live - and my EOD application did not hesitate at all. This didn't have a drastic affect on the PnL differences though, the EOD goes short and gets stopped out. What did hurt was the fact that I took the long top wick as a signal to go short - which was completely out of plan. I do get a point here for trying - it had slipped my mind that I needed the S/R support on the long wick. In fact - I recall thinking 'This looks like it is going to go up, I am crazy to short it', but I countered with 'Gotta follow the plan'. Too bad it was the wrong plan.

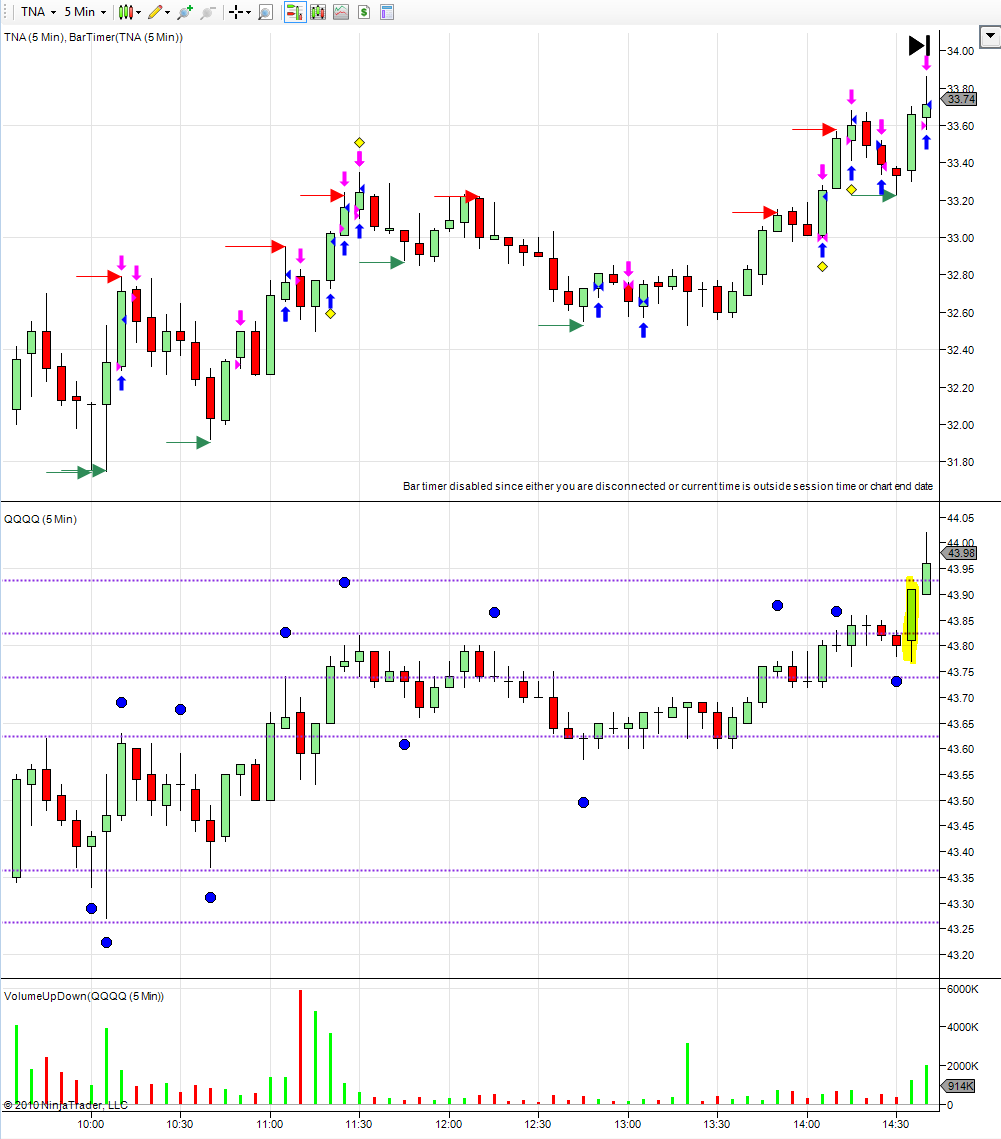
In all fairness, the first EOD application missed the next two entries (this has happened every time after I give a close review and I have always corrected the EOD application). I actually nailed the first one live, but missed the following (the 14:30 long, I tried to go long on the 14:20 which was out of plan - the wick offers no definition of direction (see note at the end of the blog where I pick it apart)). The highlighted is the signal, the red is the false, and the green is another signal. Granted - the green circle is a tough call, but here is how it is (and what I intend on following from now on) - the candle is very close to S/R (that line could be moved down in light of the 12:05 and 12:10) and the lower wick is just as long or longer than the body. It doesn't matter a lot, but I figured that since I was picking apart the prior signals, I may as well decide something here as well:


This improved the EOD application significantly (meaning my live performance is even worse... pffft), but later additions to the EOD canceled it out and then some.

My next entry was based on the 'big green' and botched. Not enough volume and more than enough strength to see in the market. Plus I waited and let the candle turn red before making up my mind (thus shorting at almost the low):


I missed the next two signals also on the first EOD pass, and for the sake of consistency went ahead and added them. I missed the first one while live (even split on the wick/body and the strength of the day) but traded the second:


The next two trades are in line with the EOD application, and I came in late on the next trade. There is no S/R here until the bottom side doji forms, so the prices on EOD are a little generous. This finishes up the day:


Note:


Ok - after much deliberation, beating it to death, and wondering all along if all this is very helpful and good for the 'go by your gut' discretionary trader that I want to be... I decided it was and got something figured out.

(And for those of you who didn't read the blow-by-blow above, this has to do with the signal on the 14:20 and why it 'matters'.)

Here is the trade (circled in red); a similar - but distinguishable - signal is circled in green (red == no signal; green == signal):


Both of these have the doji with the long tail 'bouncing' off the S/R. the difference is the candle prior and suggested price direction. The green signal is pushing off of nearby resistance with the end of the wick coming close to (i.e. exceeding the prior H/L). This makes it valid in my opinion. The red signal is pushing off nearby support, but the low wick is no where close to (i.e., exceeding the prior H/L). In my opinion, this makes it invalid.

Now - this probably has nothing to do with anything, and perhaps neither represent a higher probability trade, but I had to decide something so I know what to do next time. In my opinion this decision makes some sense and is the most consistent with what I have chosen to define as my edge.

Tuesday, August 24, 2010

End of Day Journal (8-24-10)

Summary:

Finished the day at -$195 (200 share lots of TNA, based on Q's):


The day's trading finished at around -$0.975 per share. Comparing the EOD strategy, I came up with +$2.80 per share:


A huge disconnect. Unbelievable. I have a ways to go.

So what happened?

My decision making skills are lacking. Today was choppy, and it is always easy to see the right thing to do at the end of the day; but truth be told, I hesitated a lot today - second guessing and placing several trades I had no business placing.

When I go thru the chart at EOD, I simply apply the rules candle by candle:


My edge:

Trade from 7 a.m. PST till market close.


Enter trades just after candles form doji’s on or near prior support/resistance (including new h/l), with the wick piercing thru prior candle h/l, positioning against the s/r.


Enter a trade just after a relatively large candle with big volume (in terms of the day’s activity), in the opposite direction of the big candle.


Add after there is a pause in the trend and a signal of continuation. Move the stop when size is added.


Exit when there is a signal in the opposite direction or crazy not too (crazy not to under market context)


It is humbling to realize how difficult it is to carry this out live. The big questions and second guessing today centered around 'big candles' and S/R (e.g., was the 7:00 a.m. green a point of resistance for the 7:25 stall?). The question gets difficult and I hesitate when the doji does not touch the S/R or when the wick forms in the wrong direction (opposite side of S/R). To aid in some quick, non-thinking resolution, I am going to add some definition:

 My edge:
 

Trade from 7 a.m. PST till market close.

Enter trades just after candles form doji’s on or near prior support/resistance (including new h/l), with the wick piercing thru prior candle h/l, with the long wick towards the S/R, and with the distance to S/R being less than the length  of the candle, positioning against the S/R.


Enter a trade just after a relatively large candle (with big volume in market direction, and no volume requirements in a mixed market or opposite market direction, in terms of the day's activity), in the opposite direction of the big candle.


Add after there is a pause in the trend and a signal of continuation. Move the stop when size is added.


Exit when there is a signal in the opposite direction or crazy not too (crazy not to under market context)


Trying to keep this as simple as possible, but I need to spell this out as clearly as possible to aid in the decision process. It might be a struggle at first, but I intend on asking those questions before every trade tomorrow. If there is any doubt with respect to the questions, the default answer will be no.

I mean... for crying out loud... a difference of almost $4 per share between live and EOD applied. I have my work cut out for me.

Emotionally today was still a trap. I am beginning to understand the fragile balance in adopting and applying a belief system (self discipline) and the need for a nurturing environment. People need both - you can try to self-discipline yourself all you want to, but if the environment is unhealthy (e.g., the market repeatedly ramming home the fact that you are wrong), I would suggest that it is impossible to maintain a focus on what is healthy and right. We just are not made that way. We need to take pains to protect ourselves. This goes for relationships as well. Trading... what an analogy for life... 

Details are posted for my own edification. Trade well.

Details:


Monday, August 23, 2010

End of Day Journal (8-23-10) (Day 1 of the Plan)

Summary:

Finished the day at +$51 (200 share lots of  TNA, using the Q's as a basis, paper trading):


It was good to finish positive, but I didn't stick to the trading plan as well as I should have, I think there were two times that I entered with 'I know this is going to happen so I better enter.' I am thinking about it now and scratching my head... I knew what to do today and I didn't, somehow I let my expectations slip into the trading experience. So easy to do.

I decided to do an EOD chart trade comparison to what I traded live today. Here is what could of happened:


 EOD the strategy comes out at +$0.96 per share, while the live trading comes out to about +$0.26 per share. Lots of room for improvement. I posted the details below.

Emotionally I was in a different place today, I think the addition of the trading plan is going to be very helpful.

Details:

This first chart is the EOD sim trade: flagging the signals on the Q's and setting stops on TNA. All the lines are support - included are prior day OHLC, current day OHL, and manually placed lines. It is interesting to note the discrepancies between the Q's and SPY, but I am not sure what, if anything, to make of them yet. For example, the Q's drop below current day open relatively fast, and the SPY picks up some indecision as it reaches the day's open. The SPY then goes onto soundly break thru the prior day low and the Q's touch the prior day low and back off. Maybe a useful pattern will eventually emerge:


Here are the trade points against the live trades:


It was a tough day for this strategy, the big down turn in the morning left no S/R and then the range bound afternoon kept me on the sidelines with respect to drawing S/R lines. I didn't add them while trading live today, but I did trade on them some of the time. I went ahead and added them for the EOD sim trade.

For comparative purposes, the stop arrows (red for the short stops, green for the red stops) match the trade on the following candle, so if there is a trade on the arrow candle it is incorrect. That makes the 7:20, 7:35, and 8:15 out of plan. I didn't trade on the 8:40 and 8:45 (range bound dojis). I came out early on the 9:50 and reversed. The only other 'mistake' was that my order on the 11:15 did not get filled (I placed another one after the first got stopped) and I didn't notice until 11:35.


Tough calls on the range bound afternoon, but I didn't fair too badly. If the 11:15 would have been filled I would have been very close to the sim results. I am sure some more definition would be helpful (re. what to do with a range), but discretionary trading will never be perfect, a guy just has to do the best he can.

Day 1 down.

Trade well.