"An expert is a man who has made all the mistakes which can be made, in a narrow field."

- Niels Henrik David Bohr

Friday, April 30, 2010

End of Day Journal (4-30-2010)

Another paper trading day today.

This morning still saw some NT 7 data feed problems, missed some great moves. But... I think I finally figured it out. NT has a bad tick data filter that you can set as some percentage of current market data to filter data spikes. I realized that NT was hanging on the spikes. Shutting that off gave me a problem free afternoon.

I took a different approach this afternoon. I sorted the MA list by day's high - day's low, and tried to make it a point to stick with the top few stocks listed. This is a change up from breaking new high/low which had me in and out of several stocks. After thinking about yesterday's charts I realized there were some big moves that I was missing, presumably because I was attending to another trade. This afternoon I focused on a few, watched for consolidation and potential breakouts, and jumped in. The stop limit was defaulted to $0.12 and I moved it as the stock moved (primarily in terms of time). The new stop was always based on the previous 1-5 bars and dependent on the vertical movement in the bar and the bar timer. On an exit I usually tried to wait for definite direction prior to re-entering.

I also dropped the 2 minute HA and reverted back to the 1 minute. The HA is an averaging indicator - thus the 'real' price action is not reflected in the HA candles. I thought the 2 minute may hide too much of the real price action. And - I like to know what is going on.

I also went back to 500 shares. This time I have the commissions pretty close to IB's at $0.005 per share.

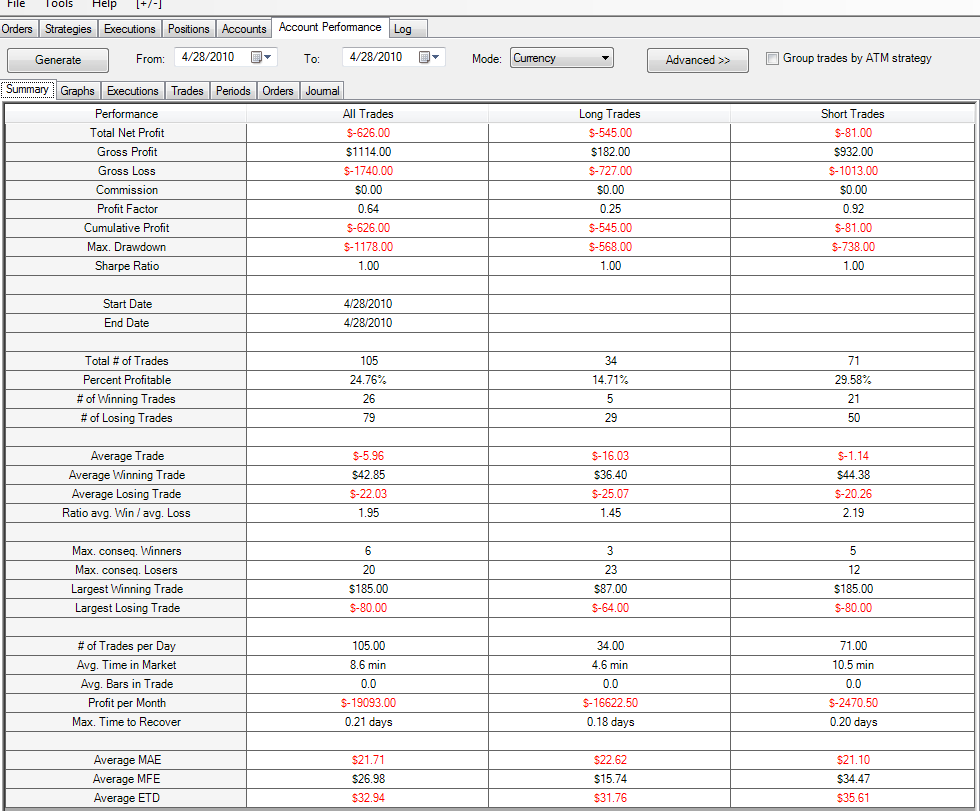
Here is the summary (last two hours of the market):


Heh - a little over $500/hour!! =)

The coolest thing about it - it felt like the most natural thing to do.

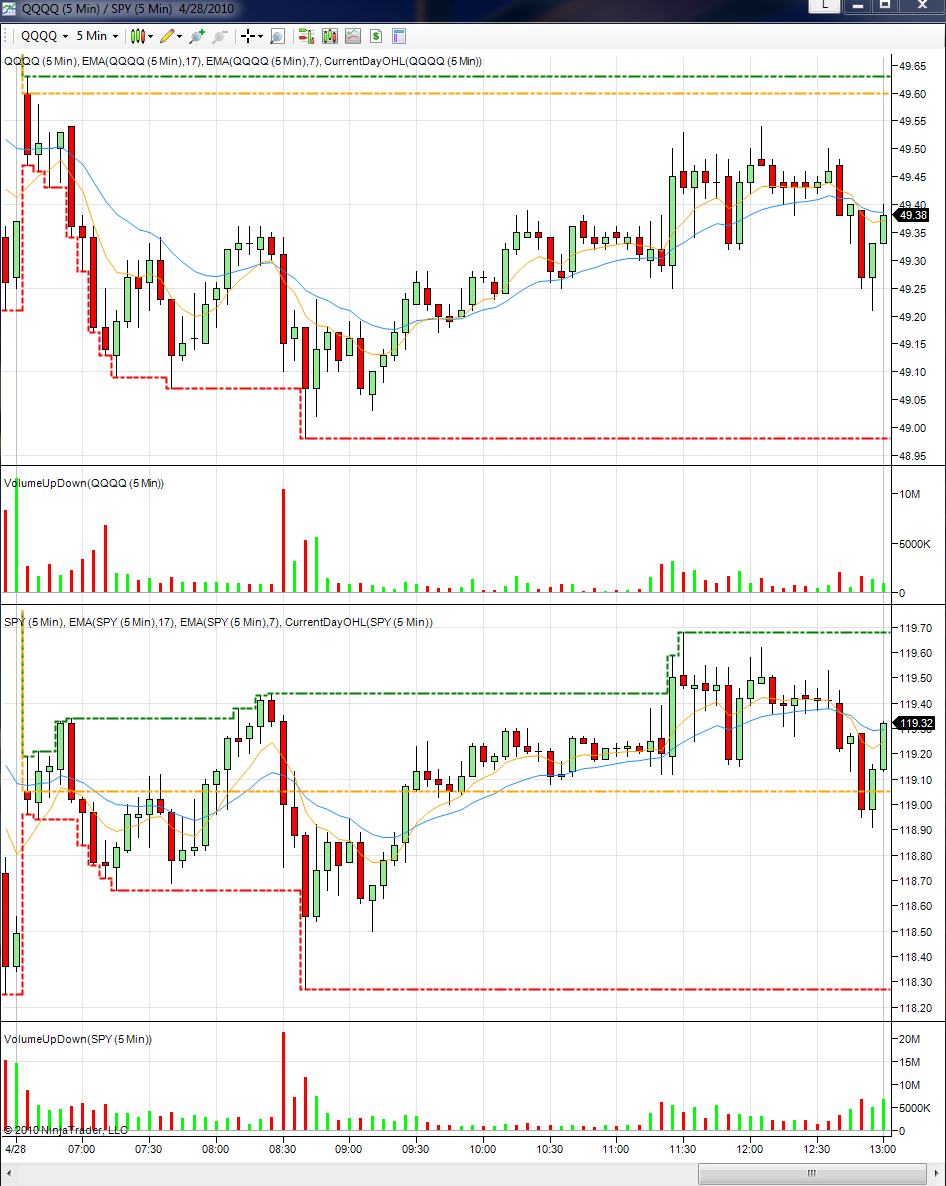
Here are the charts:

First up is CAM. Breaking new high with volume. I just followed it the rest of the day. The 12:49 pm exit was a tight stop with same bar re-entry, as with the 12:34 pm (note the times - 1 minute off of the 5 minute bar close - interesting huh? Almost like a fake out...) (+$536):


MEE on a new low. A reverse on 12:43 would have been in order for another $0.40 up and down (minus maybe a few commissions) (+$284):


RCC on a breaking high. The first stop was probably not tight enough. Reversed on the little hiccup, then quit watching when it stopped. Caught a little bit of movement later (+$223):


ESV had some consolidation from 10:00 to 11:00, after a volatile morning. It looked like it wanted to do something, so I kept watching. I entered on the long red coinciding with some downward market momentum. Again, should have kept watching this one as well - but I was busy on something else (+$45) (5 minute first, with consolidation highlighted, and 1 minute HA second):


CE on a new low. It faltered and the position stopped out. I didn't reverse this one, but should have kept watching (how many good moves can a guy keep track of - whoot!!) (-$30):


UIS breaks a new low. And I only stayed for a small part of it. I exited this one - when I should have let it stop out - which it would not have done till maybe 12:50 . Oh well. (+$53):


ANF was gettting close to a new low at 12:03, coinciding with some market down, so I jumped in. Almost shook out at 12:05 (I would have moved the stop down after the long bar, which mostly retraced). I think this was a pretty good call - with the lack of immediate upward movement I didn't reverse. If I would have been watching I could have captured a little more later in the day, ~$0.20 at the most (+$38):


Well - a good couple of hours. Who would have thought there would be that much opportunity in two hours? Not me.

I like the change in game plan. Watching just a few big movers seems like a good idea - they have moved already, and they are perhaps more likely to move big again? And then waiting till the odds are favorable for market movement, i.e., FNG's clock watch. I like the chances.

The one minute HA is a pretty cool tool. On the big moves, the respective top or bottom of the candles are flush (i.e., no wick). Using these for new stop points and keeping them fairly tight seems to offer a good read on the stock, capturing close to the top and bottom. As time progresses, and the candles don't lend themselves to a direction, tightening the stop helps to catch a change in direction. Interestingly enough, it seems like some of the fakes were on the last minute of the 5 minute bar - maybe delay the tighten on the 5 minute mark?

Seems right. But what do I know? This re-cap is a great personal exercise.

More money in the bank on Monday, but I will be waiting to trade live. If there are no problems with NT on monday and I pull off a paper profit - and if it feels right... I may start next week sometime. Cool beans.

Thursday, April 29, 2010

End of Day Journal (4-29-2010)

Another tough paper trading day.

I had some great entries this morning, but I had data stall problems and ended up chatting with NT customer support quite a bit. I also had the commission too high, so for the afternoon, feeling pretty confident, I re-set the account DB.

Here is how the afternoon session went (started a little early):


118 trades! NT counts a partial fill as a complete trade, so I am not exactly sure how many trades that is. Very poor performance. Pretty much chipped to death and no big winners. Let's see what I did.

I have been using TDA to screen all stocks based on a 7 day EMA (daily high - daily low) > $1.5, daily volume > 1 mil, and day's close >$5, <$50. I use these to populate NT's market analyzer (MA) for the day's tracking. I then try to trade off of new high/low.

I traded in 1000 share lots today and used the 1 minute Heiken-Ashi to track. I kept stop loss fairly tight, entering at $0.12 and then dragging the trigger on the chart to an appropriate graphical S/R level. Then followed the price.

The first trade was a new low on ANR. Stopped out, and tried again on the way back down, tightened the stop, and stopped out again - one more reverse would have seen part of a ~$0.50 move. Later in the day entered on another new low (entry a little late), stopped, reversed, stopped, and reversed again, only to meet the stop at 12:26. I reversed again and when it looked like it was stalling, exited (note - all of the arrows are reflective of the partial fills, I wish NT had a way to clear that). Should have reversed again (-$442):


OC came up with a new high (entry a little late) which stopped out. I reversed and followed it down, but stopped out on the sharp spike (small gain realized). I reversed and followed it up and stopped out again as the stop came up. I went long again on the new high at 11:16, but it fizzled. I should have kept watching (~$1 move!!) (+$95):


Entered EQT on the new low and and lost half the gain on the spike and moving stop. Part of the ~$0.20 uptrend would have been nice  (+$5):


A new high on JEC. This one I watched and after the stall and indecisive market, tried a short. Stopped out and did not reverse which may have captured part of the ~$0.20 move (-$38):


New high on AFL, stalled, so I tightened the stop which it bumped into at 11:07. The move up was about $0.30 (-$50):


EDZ was registering a new low (the line on the chart is a new low for the Heiken) which stalled. I reversed on the sudden uptick (coinciding with some green on the market) but stopped out with no stop movement (-$160):


 USG was creepping up on a new high, so I went a little early on the long. Stopped out on the long red (tightened). I bought back in later in the day on the long green and as it appeared to stall exited. Tried to enter again but got shook out. Reversed and stopped again (-$93):


Failed new high on AGCO, tight stop (-$46):


Failed new high on DHI, exited on the consecutive dojiis. The next hour saw some drop, but it is only about $0.15 (-$20):


Tried to short the new high on BVN (market was long red), stopped out, reversed, stopped out. Entered the short and exited with a small gain (-$61):


ESV was coming up as a new low on the MA for some reason, regardless, it looked like a good entry. Later I tried to get in on a bounce (-$38):


New high on CRI which I tried to short as well (more red on the market @ 11:47). Stopped (-$52):


Long on POZN's new high. Tightened stop. A reverse may have caught part of ~ $0.40 (-$20):


Failed new low on PFCB, did not tighten the stop and opportunity for ~$0.20 on the reverse (-$180):


Tried to reverse a late entry on a new high on NUS with QQQQ showing some downward movement, stopped out. Not much to capture on a reverse (-$60):


Strong bars and an SD alert on DCTH convinced me to jump into DCTH. Ended up being near the high. Stopped out (-$82):


So what did I do wrong today? I lost $1222 paper trading dollars.

There were several opportunities for reversing yet again. Let's say I would have captured 80% of the move: ~$2.95 * 0.8 total at 1000 shares = $2360 gross; maybe $2300 after commission. This would have put me positive $1100.

But - I am not sure that is justified; I made the decision, for whatever reason, not to reverse. Looking at the three biggest misses (ANR, OC, and POZN), the market trend offered no support for another reversal on ANR or POZN. Well with a little bit of imagination I could of drummed up a little support:


Probably not enough.

Checking out the 2 minute Heiken though:

On ANR:


And OC:


And POZN:


Definitely (moves are highlighted). This might be a better trade tracking chart to work with. Looking at the 2 minute ANR, I can't say that I would have traded the new low much differently, and I may have just been tired of getting it wrong and still opted out. OC, on either the 1 or 2 minute, I just should have been watching. POZN shows some strength.

Other than that, I had a few entries that I probably shouldn't have done - well they are not in FNG's 'The Finger' strategy. There were some big moves today, just not many going into and away from the new high/lows. ANR is the biggest loss, and probably due to not letting the move play out.

Maybe my MA list was bad for the day, but the list has not varied that much from day to day. And I am running an SD alert watching for big moves and only 21 alerts triggered. Most days it is well over 50. Tomorrow I will try the 2 minute HA for tracking.

Anyhoo - good end of day exercise.


Wednesday, April 28, 2010

End of Day Journal (4-28-2010)

Blah. I couldn't seem to make anything work paper trading wise today. Here is the summary:


I had some connection problems with NT and got started about 30 minutes late. As it turns out, NT. B14 is not yet compatible with TDA's data stream. I won't even have to try tomorrow =)

Morning session started with new high on BVN. I happened to buy right at the peak and stopped out in the same bar. I reversed and exited on the 8:15 doji. The 11:20 entry was a faltering new high (coinciding with the long greens on QQQQ and SPY). In the afternoon I tried another new high. I stopped out, reversed, and stopped out 2 bars over.


For comparison purposes - check out the Heiken Ashi chart of BVN (which I am trying to use for trend analysis, rather than the 15 min candle):


It looks so easy in retrospect...

Next was WLP on the TDA screener alert, long bar and breaking new high, after BVN's new failed I went short, cut the loss early and reversed, only to get stopped out on the long bottom wick on the next candle. Ouch. I bought in right away again and rode it up to the doji. I reversed right away, but changed my mind as it broke a new high again. Reversed again, stopped, shorted... and then I don't know what I did. It is hard to follow the action on a 5 minute chart:


Here is a 1 minute of the morning's action, for a better interpretation (though I confess this still leaves me wondering what I was thinking):


  Anyhoo - after WLP the account was -$107.

Caught a little bit of profit on CE's new low, then caught some later in the morning. I tried to increase the size at 9:49 but exited on the next candle. The record shows I went long, but with the lack of volume and the market showing some downward movement, I exited. I called that completely wrong:

 
Zion caught my attention earlier, but I missed the new low. I was watching for a bounce, and came in a little late. Red, green, red green. With the +-$0.20 choppy wicks, it was too hard for me to call. Later in the day I tried the new low and managed to stop out on the long high wick:


Failed new high on AIG, stopped out in the same candle:


New low on USG, after some nice long candles. The 5-min doji probably should have been a heads up, but it lacked volume and I ignored it to much my chagrin:


Failed new low on DSW, stopped out:


That was pretty much it for the morning session. I went a little long (~9:40 my time), but the market seemed to justify it. It looks like I missed some 7:30 opportunities, but still plenty of entries. Just none of them that good. The account was at -$603 after DSW. I started trading again at 11:00.


SPY and QQQQ were extremely choppy the first part of the afternoon - note the long green  followed by the long red a few bars over, followed immediately by the long green  ~ the 11:30 and 12:00 mark. I guess I need to be ready for this as you can see in some of the trades - but how can anyone be ready for this?? Maybe more experience.


MET, ahh MET... thanks for trying to redeem the account. I entered on a new low, exited and reversed after it broke thru two previous opens, Stopped, and reversed. The next candle breaks thru previous open, so I reverse again, and get stopped. Reversed again, only to watch it break thru again. Rawr. Finally get it right at 11:36 and scale the position up at 11:59. The funky market action (long side by side reverse candles) and increasing volume kept me hanging on thru the bounce and subsequent dojis. I sold on the larger volume green and re-entered the short late for a slight loss on the exit:


Consistent new highs after the big green on the market looked like a good entry on TCK. Chop city. I finally got the last short about right:


New low failed on VLTR, tried again later and stopped out (hindsight says the days cumulative volume was way too low ~400k):


HUM was coming up with new highs all day with small candles and fizzling. I bought in after a dip and increasing volume, and stopped out (and unfortunately did not reverse):


That was pretty much it for the day. 105 trades and no commissions on the P&L (since I entered the schedule incorrectly this morning). The stop loss worked well today, and I found out I can move it manually via the graphics, which will be better I think.

Hmm... comparing the day's trading patterns to FNG's 'The Finger' strategy, I think I am following it reasonably well in terms of entry. It seems I have a problem staying committed in the first candle, and not letting the candles play out, e.g., WLP (commissions would of put a serious dent in the account). Maybe I need to wait for the last minute of the candle prior to entering. I am just thinking out loud here, but I may as well be using one minute candles if that is the case. Which flies in the face of FNG's advice - a definite no-no at this point.

But for what it is worth:

NT has a pretty cool feature - something they call the bar graph. Here I have a 1 minute candlestick plotted on a 5 minute bar (WLP):


And perhaps even more interesting, a one minute Heiken on the 5 minute bar:


Looking at the 1 minute HA offers no justification for the ins and outs. Of course this is hindsight, and I am very reluctant to introduce something outside of what FNG explains and does so well.

As I was reviewing this post prior to publishing, I thought it might be good to post MET and ZION in the same format. Here is MET:


Here is the first trade on ZION:


And the second:


Looking at these, the MET trades appear justified. Zion entry looks good, but the reversal after the stop does not. The next short is ambiguous. The last exit looks early, but the HA has some pretty long wicks.

A good test would be to try some of these trades over again using NT's replay feature. Maybe I will tonight if I can find the time.

.