Summary:
Paper traded 200 share lots today with the primary goal of sticking to the exit plan:Largest losses:
Largest stop was $0.41/share on CHSI. The spread was all over the place.
Largest wins:
The largest profit was $0.87/share on NFG.
Not many wins today. Of course in hindsight, there was money to be had all over the place, but I found it very difficult to cover into strength - the direction shows up and my tendency is to assume that we are back in trend, often this ended up being a double top/bottom (LNC is a great example).
CRM was perhaps my biggest experiment today. There was a doji right on the even dollar and I chose to let it go to see what would happen. I had $0.90 on the trade at that point. I ended up losing 2/3 of the profit.
MET was another one that I decided to let go (partly based on the swinging wicks on the 15's), and then I added at precisely the wrong time and later got stopped. This was a >$0.50 move.
The charts include the same exercise as yesterday - I marked the best possible exits and then tried to characterize them (for visualization). Not as clean as yesterday's, but I think the exit strategy is still valid.
Trade well.
Details:
AZOI missed the first breakout and the second ended up being a double top. Examining the first breakout of the day, the prime exit is marked by a big volume bar and even dollar amount ($223.00):
BG
One of the few that I actually managed to exit on plan. The signal to exit is marked shortly after my entry (topside wick on the 1:45). I placed a target limit sell at just below the prior high and let it go. Looking at it now, the 15 goes on to show wick on the bottom side signaling potential weakness to the downside. I am thinking that this should prompt a removal of the limit order? Nothing to mark the prime exit.
CECO
First entry was a failed breakdown, but the lunchtime had some direction. No signals on the prime exit - except perhaps the negligible volume as it touched the low:
CHSI
Prime exit marks topside wick on the 15. I did consider setting up a limit order - but it was one of the first trades of the day and I wasn't sure if the size of the 15 warranted setting up an exit. It would of been the thing to do - probably would of kept me out of the late short:
CRM
Lunchtime breakdown with the prime exit marked by the doji on the even dollar ($118.00). I thought about covering there and at the red diamond, but I thought I would let it run to see what would happen. I started taking it personally when it climbed above my entry - from positive 90 ticks to negative 5 ticks - heh :
GMCR
I didn't trade this because I had a full palette when it broke down. I listed it so I could watch it. Nothing here to mark the prime exit, but the bottomside wick on the 12:15 should of been my signal to start looking:
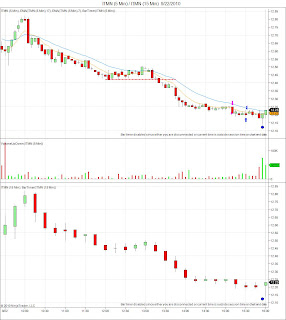
ITMN
I didn't trade the earlier breakdown, but tried later. The prime exit is only marked by the high volume new low?
LNC
The breakdown didn't work, so I reversed. Not much to mark the prime exit - it could of just as easily been setting up for another breakout. Crazy how the actual exit corresponds with the bottom of the 1:30 doji on the 15:
LO
Breakdown and stop; probably not the best setup:
MET
Late on the initial entry (timing is critical). Reversed, stopped, reversed again. And stopped some 1.5 hours later. when the 11:45 showed bottomside wick, I placed the limit order, but it came all the way back. Again - almost crazy how it came right to my stop. I shorted right away again. No signal for the prime exit, but the bottomside wick on the 1:30 would of said to place a limit. But I thought the 1:45 was showing weakness on the top side, so I removed it:
MJN
I think this is about as good as it gets for this exit strategy:
MR
Prime exit was marked by the big volume doji:
NETL
I followed the plan on this. After the 12:00 showed bottomside wick, I placed a limit order and let it go. It was filled on the 1:10. After it filled, I saw the big red candle and assumed it was going to keep going, so I shorted again. It turned into a double bottom and didn't stop going up the rest of the day (showed some hesitation at $25.00):
NFG
About as good as it can get with this exit strategy. I proceeded to give back half the profits:
NFLX
I missed the breakout and tried to go short which didn't work. The prime is marked by very large volume - and one of the largest candles of the day:
PRGO
Another one I didn't trade. Prime exit is marked by the large volume doji:
PSA
This one is a mess. But it looks like I tried twice:
RADS
Prime is marked by a large volume bar. The prior candle was a low volume relatively big move. But - not a very good move to begin with:
SKX
About as good as it gets for this strategy, the first breakdown would of been nice:
SVNT
I didn't trade this, but I actually was watching it when it hit the $22.00 mark. Scott traded it and I have no idea how he managed - the spread was crazy, and it was bouncing around very fast. Decided to post it because it hit the even dollar on the top, then found support right near the $21.00:
TD
Didn't trade this one either because I had too much when it broke down. Prime exit marked by the new doji low - on low volume. Notice the stall on the $72.00 - where it found some support. The plan would of had me out on the first diamond:
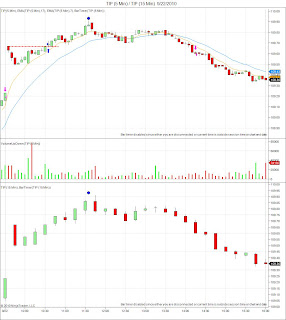
TIP
Nothing to mark the prime exit. I placed a limit after the 11:45 wick, but it didn't come back:
WDC
Prime exit marked by a doji on the EMA. The 1:30 doji on the 15 said to place a limit, but it never came back:
WMS
The first breakdown left plenty of time to get out (15 min wicks), but the prime is not marked:


is it possible that these moves happen everyday and somehow we have missed them for past few years. i can't believe the same signals come day in and day out. i'm getting paranoid that it's just the market playing our tune for right now.
ReplyDeletethe trick for you, is to try to get the entry at the apex of the triangle, on the pullback, and not right at the breakdown. but maybe thats how these triangles work. one step at a time.
awesome stuff. nice charts. more to ingrain in my brain tonight.
I don't know - I think they have been there all along. And I missed a bunch, ones I didn't bother to list. I have been thinking that I need to keep watching them - they will sometimes retrace back to the breakout before really moving.
ReplyDeleteWish I could see/think of the exits like Scott does.