Summary:
Day 3 of practice.Bit of a lazy day, trading was interspersed with the USA v. Algeria game, and a nap afterwards. I wasn't expecting this, but I find this approach somewhat boring, first time that I have been bored while trading, and I caught myself wanting to avoid the exercise. I think this is telling, but I am not sure what to make of it; it might be the reason behind the numerous entries on prior weeks. Learning something about myself - progress!
Another thing that I noted today, my intuition might not be that great at picking out S/R. The problem with not having a clear idealized model is that I can tend to get hazardous with visual inspection: 'Ah yeah, that works.' and move onto the next. I want to take a little time to make the S/R concepts more specific, using an example from today.
Mr. Faith references 'anchor points' in his book (Trading from Your Gut: How to Use Right Brain Instinct & Left Brain Smarts to Become a Master Trader) (and a lot of other great things, really, you should check the book out... err... of course, it hasn't exactly worked for me yet... so maybe you should save your $25 until you see a difference in my trading; e.g. making money): to be an anchor point, the primary criterion is that it be visually distinct and separate. PXD offered a great example today:
(The 9:55 close is a perfect spot for an entry using his rebound strategy anchor violated with a retrace, stopping out all the early shorts.)
I want to adopt this as part of the S/R definition.
I also think that it would be good to setup a consolidation S/R definition. Again, PXD offers a great example:
I want to avoid bringing numbers into this game, but consolidation S/R could be defined as some price level that has been tested about 3 times over some length of time. You will notice that the S/R is actually violated on both ends - key for entry timing in this case is the market. You can see on the background plot (Q's) that all the breakouts are re-enforced by market action. I think I am going to add that little tidbit to the market visualization check.
For a better visual, I highlighted the bars on the Q's that match the breakouts. Interestingly enough, in the case of PXD, the Q's also highlight the anchor (the first highlight) (The horizontal dotted lines are what I drew as the market was unfolding today; it might be hard to understand some of them, but it is easier and faster to draw extending horizontal rather than trying to get a straight line segment, just remember they are not valid for both directions):
So - another post sometime before trading tomorrow: update on the S/R definition and market signals.
On the profit side of things - after an update on the exit definitions, I fully expected and anticipated making money today (on paper). Heh, not to be. But still, I traded well and according to plan. I think the extra definitions will help. The 9:40 breakout would of been the ticket, but I was eating breakfast...
-$634
Details:
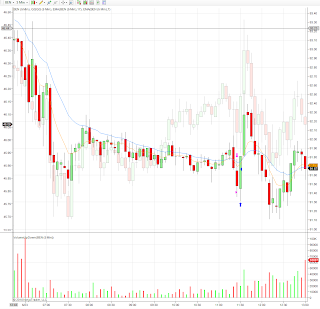
BEN: hitting new lows as the market broke support (-$127):
CXO: stopped, then closed on the stronger volume and some green. The third trade was a discretionary exit as the market was trying to make up it's mind, I don't think I could of played that much better (-$2):
DO: Ok... I am trying to make sense of this one. I think what happened was that DO broke resistance on the candle prior to entry, and then reversed; I shorted as it broke thru the same line. The next entry was good on all accounts (+$5):
FTI: Looks like this was based on the same theme as DO, albeit the entry was much later, I think it was thru what I was calling support (+$72):
GG: (-$41):
LULU: Here you can see the DO and FTI concept a little clearer. The stop on the second entry on should have been just above the support, but the market was doing some crazy things and I felt better about being closer to the prior candle close. I think I was getting into analysis mode on this one (-$171):
PXD: A little early on the entry, but I felt the market justified the decision (-$94):
RL: Out on the 1/3 retrace. A little harder than expected - it is hard to know what a third of the candle is before it is finished (+$59):
UPL: After realizing how tight the range was, I attempted to move the stop down a tick or two below the support, wasn't fast enough; thinking about it now, that is not a good practice (-$37):
V: Direction in both of the first two entries, but the market was all over the place. The third entry was based on the price breaking thru new 'support' (-$298):


i put up a couple charts of RL so you can see how maybe you can figure out if its a third or not. i use the Fibonacci retracement. one of the charts shows the standard settings i use at 38.2, 50, 61.8. basically, you place that over the move and believe that there will be a turnaround at one of those levels. traderx or traderjaime (wallstwarrio) have much better explanations and descriptions. actually i think that was jim on your blog the other day (who got us confused) from wallstwarrior.
ReplyDeletethe other chart, i manipulated the fib levels by right clicking, properties, and only showing one level at 30%. i'm pretty sure that would show you a 30% retracement on that candle. hope you enjoyed my spelling tonight.
later
you would have to adjust one end of the line, in this case, the 0% line up and down as price moved.
ReplyDelete