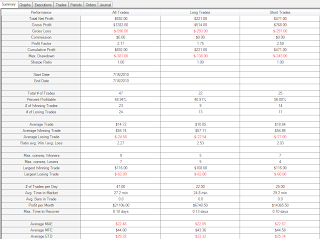
Summary:
Finished positive at +$692. 200 share lots and all on paper:
A word or two about the trades. I watched the Q's and traded the ETF's today, bulls and bears: TNA, QLD, TZA, EDZ. Red arrows mark short entries or long exits, green arrows mark long entries or short exits, the red diamonds are stops (Q's):
I saw market weakness and had a short bias for the morning. The way the 7:35 was shaping up looked fantastic. I can't say that I would of called it any other way, but looking at the 15 gives me some pause. In fact, after the stop, I went long - and the wait on that exit was a bad read. The 15 minute is pretty clear on the exit, and I should have been looking for the chance to get out with all that indecision floating around. The 15 minute spinning top on the 8:00 called the short and I was a little late. I got stopped on a few of the ETF's but came right back in. Timing is so crucial, being late to the game lends itself to being stopped out too quickly.
The short on the 8:35 was looking good. I had some pause on the 9:05 rebound, but I stayed in and doubled up as it continued. Heh. It was one of those 'What would Scott do?' moments; we can debate the wisdom of that I suppose.
I exited on the 9:50, losing most of the profit, and right when things started to turn around. Unbelievable. Earlier I was thinking that the 9:05 should of been the signal to get out - a new low that finished green. But - perhaps the stronger signal was the new lows on lower volumes; specifically the 9:00, 10:05, and the 12:25. Could of pulled reverses on those, looking for a quick profit and waiting for the market to return to trend/bias. Much more in and out - but I think a more consistent policy overall (at least for today). I like it.
Ok - well this pretty much sums it up till I get back from Costa Rica. I may have time for an early morning session on Monday, but not planning on it, depends how the weekend goes. It is nice to finish strong.
Details:
EDZ (+$148):
QLD (+$212):
TNA: you will notice that I got stopped out more on TZA and TNA. And on the 12:15 short, I actually set the stop way up on the prior candle high to avoid the stop - bad policy; I was negative 50 ticks at one point lol. Entry timing is critical. (+$209):
TZA ($123):
Extra charts:
I recorded buy/sell volume again today and I started trying to find some patterns after the market closed. Mixed bag. Funky strange beast, I think it would be wrong to read too much into this, but I still want to give it a little more time. It seems that the one side can be outnumbering the other side by a significant margin but the candle will still move in the opposite direction. The chart below with the Q's is a good example. I marked two doji's and a pretty solid red candle. Re. the doji's I would at least expect to be able to have some suggestion as to what was coming next via the buy sell. The first doji has more buy then sell - yet it was a classic short signal. The next doji shows quite a bit more selling than buying - and this worked out for the immediate future (i.e., the end of the doji would have been a good short for one silly low volume candle). The last marker shows a solid red candle with quite a bit more buy volume than sell volume. Again, this was a precursor, but only for the immediate future:
Q's:
Note: the first volume candle is invalid - the volume is about right, but I logged on sometime during the candle formation so it should be discarded. It would be kind of cool to see how the candles prior to that were playing out.
Again - I am beginning to wonder about the value of static historical charts (I corrected yesterday's entry). It seems to me that the real value comes from how the candle unfolds, or the speed with which the candle moves up/down. I don't know, just a hunch.
Fozzking posted this yesterday - we probably have the same readers, but thought I would pass on a good thing.


+_+QQQQ+(15+Min)++7_16_2010.jpg)
+_+EDZ+(15+Min)++7_16_2010.jpg)
+_+QLD+(15+Min)++7_16_2010.jpg)
+_+TNA+(15+Min)++7_16_2010.jpg)
+_+TZA+(15+Min)++7_16_2010.jpg)
++7_16_2010.jpg)
nice day brother. that much dinero on 200 shares is sick!
ReplyDeletei don't get this buy sell volume at all. first, if the day is going down, shouldn't there be more sellers than buyers. second, and this is where i get really weird, shouldn't the number be exactly the same since for every seller there has to be a buyer and vice versa? or is it, volume at the bid/ask, like the buyer (bid) is getting their price vs. the seller (ask) getting their price
yeah - it is the bid/ask. NT calls it buy/sell, but it is actually the number of shares trading at or above ask,vs. number of shares trading at bid or below. Basically it is saying who is more nervous and anxious to get the trade: buyers or sellers?
ReplyDelete