"An expert is a man who has made all the mistakes which can be made, in a narrow field."

- Niels Henrik David Bohr

Tuesday, April 27, 2010

End of Day Journal (4-27-2010)

Another glitch filled first hour of the day, but I got things ironed out and managed to get some trades in. Here is an account performance report (courtesy of NT):


A pretty good day, but it could have been better. I started off with 1000 share entries (30k cash, 60k margin, all on paper) with a $0.07 stop loss and a $0.08 auto breakeven. I was stopped out several times with some major slippage. And I had some awesome entry points.

Here are the charts:
Long entry on ESV (expecting the failed new low and reverse), stopped, reversed, stopped. Missed the nice drop. Shorted (??huh?) at 8:35 with a stop.


(Vertical arrows are entries, horizontal are exits).

Short on APC (after the ESV and definite market momo action), bailed at the 8:30, attempted to re-enter and stopped:


Short on USG, exited a tad early, re-entry on the next bar and exit on the following (whoot!) (after APC the account was at +$1226):


Tried a little too hard on X, with long candles, plenty of volume, new lows - I thought - 'Why not?' Fizzled and then the tight stops became a problem (stop, re-entry, stop re-entry, and tried to get some long action). Quite a bit of slippage on the exits - the account was down to +$593 after this debacle - not including commissions.... :


Short on SNDK - and panicky exit (a little jittery after X):


Tried to catch VMW coming off a bounce - thank you stop:


That was it for the morning. Quite remarkable how similar the basic shapes of most of those charts are. The afternoon session started with the account at +$504. I had had enough with the tight stops, I am not good enough with the entry timing yet. I switched to 500 share entries and $0.12 stop loss for the afternoon and kept the auto breakeven the same.

Failed new high on EL... well didn't fail, but I bailed prior to hitting the stop:


Failed new low on ADS, I thought the volume was too low for the reverse:


I bailed on an ATI new low after considering the volume. Should of thought of this prior to entry:


Shorted BHI, auto breakeven kicked in, and stopped out. I reversed and finally called it quits at 11:54:


Failed new low on BAX, finally bailed at 11:34. In hindsight I should of reversed, but the volume was not convincing enough when I exited. Maybe the EMA's should have been an earlier clue?


Sometime after this I decided to bump up the auto break-even trigger to $0.10.

BVN popped up on the TDA alert with a long bar and new high. I went long, but didn't hang on. I re-entered, and left early again. Tried a short on the reverse, stopped, reversed, then bailed early again. The last two positions coincided with new lows on SPY, and I did not feel that good about the chances. In retrospect I could of done much better, but I think I would probably do it the same again:


Auto-break even kicked in on the first TNA short on a new low (it had not been adjusted yet). I re-entered (I thought it still looked good as evidenced by the pink entry on the second candle) only to stop out:


Shorted the new low on AIG. Attempted to reverse and stopped out on the 12:05. Reversed again, and bailed before the stop - and too early:


Alert on COP, went long, stopped, tried to reverse, stopped, and auto-break even kicked in. I should have kept watching:


Shorted JCG on the new low, exited a little on the early side, but done for the day:


The tight stop loss, combined with the slippage - and me trying to make things happen - on X put a big dent in the account. That can be remedied and I think the afternoon session reflected the changes. I am sure both it and the auto-break even will still need some adjustment.

I like the hard stop loss - as the day progressed I found myself thinking more about where the $0.12 stop loss would put the stop graphically on the chart, and I found myself trying to time the entries so that the stop would correspond with near term support. I think this can only get better.

Some early exits, primarily on BVN - which was going against the flow. I caught most of the moves on the late afternoon action - it could have been better, but - I can't expect to get it perfect.

NT's market analyzer had some pretty colors this afternoon:


This was at 3:45. There were times when more than half of the LastMinusLow column was at 0. I couldn't time the capture.

98 trades but this reflects the partial fills as separate orders.35.7% of them were profitable. I guess there is something to cutting the losers and letting the winners run - even as badly as I executed it today.

Still working on NT's beta problems - but when things work well, they work very well. So I think I am going to stick with it.

Monday, April 26, 2010

Interim - system glitches and real trades

One of those days.

Paper trading showed several perfect morning entries, playing new high reversals. Mornings and failed new highs/lows seem to be a common theme lately. Afternoons seem to lend more urgency to the breakouts. During the course of the day I reset the NT database, so nothing to show.

Three live trades today: UAUA, and two on FTBK.

I was using NT for monitoring the action. UAUA came up first and after looking at the chart, I thought I had a nice entry at around the 10:45 mark. Things stuttered along until I noticed the chart not updating any more. I switched on some TWS charts and was presented with a completely different picture. I checked SD for some confirmation, and it started to look like NT was acting goofy. Meanwhile, stop loss came and went at ~-$289. A little bummed. I won't even present the chart because there is nothing to look at.

I caught the 11:00 a.m. outbreak on FTBK, came out nicely at ~$1100 at 11:05, but jumped in again too early and ended up at ~$359. With the bummer loss on UAUA only ~$70 for the day.

FTBK was a trade I shouldn't have made. I was coming out of the UAUA debacle and still a little scatter brained. And emotional lol. My palms were sweaty. That should have been the signal.

As it turns out, I was using the latest and greatest version of TWS, and NT recommends using an archived version they have on their site; hence the price discrepancies. It was disturbing at the time. Afternoon went off without a hitch, but I was communicating a lot with customer support and didn't get much trading in.

Despite all of this, I still think NT is worth the effort. They have some great features and a lot of this is just my learning curve. The chart trader is very nice, the reverse position function makes for a clean and fast reverse. The ATM strategy automatically scales as a position is scaled. And - if I can ever get a solid data stream, NT will record the days ask/bid data for later replay and practice trading.

I decided to bump up the account to day trading minimum +5k. It will take awhile for funds to settle and I may keep paper trading for awhile - but I am gaining more confidence. Silly me.

Friday, April 23, 2010

Interim - progress

I made several mistakes on the paper trading account which have not allowed any trades the last two days. Pretty bummed.

However - remembering that NT had a simulation account, I booted it up and was pleasantly surprised to find the latest beta ready for public release: NT7 B14. I upgraded and spent most of the day yesterday getting things going. And as it turns out, today as well.

First thoughts? Awesome - the upgrades are significant and I am finding that I really like the chart trader application. Coupled with the ATM strategy (which allows for a fairly complex stop loss setup), great charts, and in-depth account analysis, it is a very sweet platform. There are some bugs in their Market Analyzer, but I had a fairly stable afternoon. I am hoping the MA will work as a substitute for the TDA screeners.

Here is an example of a failed short term breakout on AIG:


Here is some ADSK action (with order marker and labels turned on):


One of the new features: multi-instrument charts. I have QQQQ and SPY on this one:


I am still trying to figure out the ATM strategy, but so far I have something like: hold stop loss order on my computer until touched (simulated stop limit), set initial stop loss at 12 ticks, when profit reaches 8 ticks set stop loss to break even, when profit reaches 10 ticks set stop loss to 8 ticks, then update 8 tick stop loss for every 3 ticks in profit. And - on top of that, I have the volume trigger set to 200 shares which helps to avoid spikes (In addition to the stop loss trigger, the ask volume must be less than 200 shares). I am sure I will need to play around with it, but pretty cool stuff. As per FNG, I have no profit target set.

I think that automatically setting the stop loss will help lend some gravitas to the entry decision, forcing me to think about entry with respect to near term candlestick action. Time will tell.

But: I had 6 crashes (about), 2 re-boots, and 2 database repairs, which was very frustrating. It seemed to be tied to the TDA data connection and refreshing a loaded MA data set (e.g., changing the columns). This afternoon saw one crash when I tried to disconnect IB. For some reason ask/bid were very slow to load using IB as the primary. Anyhoo, if it works well next week I may subscribe for a quarter.

Wednesday, April 21, 2010

End of Day Journal (4-21-2010)

I have been having problems with the paper trading account - Monday I reset the account to $25000, with the first trade of Tuesday being a loser, IB did not allow trades after the day trading minimum was violated. I reset the account for $30000 for today, but IB was having problems with the paper trading accounts - I was only able to trade ETFs.

Missing all the screener entries was a little frustrating, but I traded EDZ and TNA. TNA pretty much kicked my butt. EDZ showed a mediocre morning and a decent afternoon. Here are the trades:


EDZ saw a mistake on the first entry, the account did not meet margin requirements, thus the 1000 shares default  switched up to 600 sold. This presented a problem on the exit, which defaulted to 1000 shares, leaving me holding 400 extra shares and not realizing it for about a minute. Looking at the chart I am not sure what prompted the second short, but it met and surpassed the stop.I then tried a late reverse while it was approaching a new high, only to again meethe stop. I finally caught the flow with a good exit and reverse, and early cover. I tried to get back in on the drop, only to be immediately stopped. I tried to reverse to meet the stop again. I was nervous on the short just before the nice drop at 12:10 and got out too early. The afternoon saw a mistaken short, reverse, late exit and reverse and a stupid, nervous exit:


I noticed TNA had twice the movement while I was goofing around with EDZ. Frankly, I am embarrassed to put this one up, but it is what it is:


Ummm.... I don't know what I was doing. Except trying to read the candles and market movement and not being afraid to change my mind. It went something like, entry, stop, reverse, stop, etc., etc n(starting with a short). Nibbled to death.

What should have been my clue? I am not really sure, just glad it was paper. I was in a good position for the first reverse position, and should have stuck it out to the positive, but the rather large candle at 15:00 had me reversing and then back and forth with stops. Several long candles with wide subsequent high/low spread. Profit kept showing up only to disappear, no clear direction. Feel free to offer some interpretation here.

Not sure how to take today. I was ready for some very good entries via screener, but couldn't trade them. I do not think I would have traded in EDZ and TNA given the numerous other 'good' opportunities, but who knows for sure. It is all about being picky with your entries. But I did enter these fully expecting to make money. Hope it works tomorrow.

Monday, April 19, 2010

End of Day Journal (4-19-2010)

Crazy busy weekend.

Friday saw a +$2200 paper trading day. The day ended up only being the morning session, as my ISP was having problems during the afternoon. This also prevented me from posting before heading out of town late Friday. Lots of in and outs, and one bad stop. Overall a great exercise - the ISP going down forced me to check into what would happen if the service went down while trading live. I think I have everything in place now.

I meant to paper trade for the most part today as well, while keeping the income account open for anything that looked very good. Unfortunately, I had re-set the paper amount on Friday morning, but was left holding a position when the ISP went down, so this morning saw the account with no margin available. I couldn't place one trade. I re-set the account again and watched for opportunities.

Three trades for ~+$1300:


Here are the charts in all of their glory.


I went short on ANF and almost got stopped out. I think I need to pay attention to and be ready for the dr4op in action and potential exits ~ the 12:00 p.m. mark, I covered a little on the late side:


The afternoon session saw  a lot of potentials. I picked RCl with a short at ~14:00, but covered and reversed 10 minutes later. The reverse was a little early, but QQQQ was showing strength:


For some reason I cannot see the short entry on the chart. I am not liking these charts very much.

Good day for me. But strangely enough, I was not all that giddy about it. Realizing that I happened to be at the right place and ready for the swing - and ready to be wrong - has a strangely calming effect. I caught myself several times today watching the profit rising and thinking along the lines  of - 'What is my profit target?' Heh. At least three or four times on RCL. Each time I made a conscious effort to get my mind off of the profit, take it patiently, and let the stock tell me when to get out. Fully expecting that anything can happen is an awesome place to be.

Paper trading the rest of the week. If things go well, I may place enough money in the account to meet the day trading requirements.

Oh yeah - here is the account chart:

Wednesday, April 14, 2010

End of Day Journal (4-14-2010)

Trading like there was no tomorrow and finished -$398 on paper today.

BYI saw some relatively good timing, but there was not enough movement:


I caught some of the up on ANN at 10:50, and tried to double at 11:15, bad decision (I need to remember to ask myself, double or get out?):


A little early on the entry, and I should have stopped out. I doubled at 11:15, only to stop out:


Wrong entry on HES (thanks to not having implemented the click/key combo yet), and then I couldn't make up my mind (REVERSE AFTER THE BIG CANDLE!!!). Caught some of the late action at 11:10, with good exit at 11:30. I re-entered right away, but forgot to pay attention and let everything get away from me. From then on it was more of a click fest - I finally gave up:


Good entry on NOV at 11:10... but I let this one get away as well. I was holding too many positions and not paying enough attention. Another click fest with some recovery. Silly me:


Stopped out of JOYG:


ITMN was a good entry, but this was the 11:10 slot that I let get away:


Good entry on BHI, covered the reverse, stalled, then stalled again:


AIG stopped out, bought again, stopped, shorted, and didn't wait long enough. By this time I was a little flustered (11:40):


The morning session saw some excellent unrealized returns (~$1000), but by ~11:10 I was in the 'Heh, this is easy, I know where everything is going' mode. A few stops on other trades and by break I was down $1400. What a shame.

I took a mental breather, a shower, and some stretch out meditation time as a confidence boost. I ran thru what I did during the morning session and I came to the conclusion that I was not constantly asking myself 'Does this stock know where it is headed?' It is not my job to tell the stock where to go, but rather to be constantly aware of where it is telling me it is going. My responsibility is only tag along for the ride. If the stock doesn't know where it is going, then I have no business in trying to give it direction. I determined for the afternoon session to maintain constant vigilance.

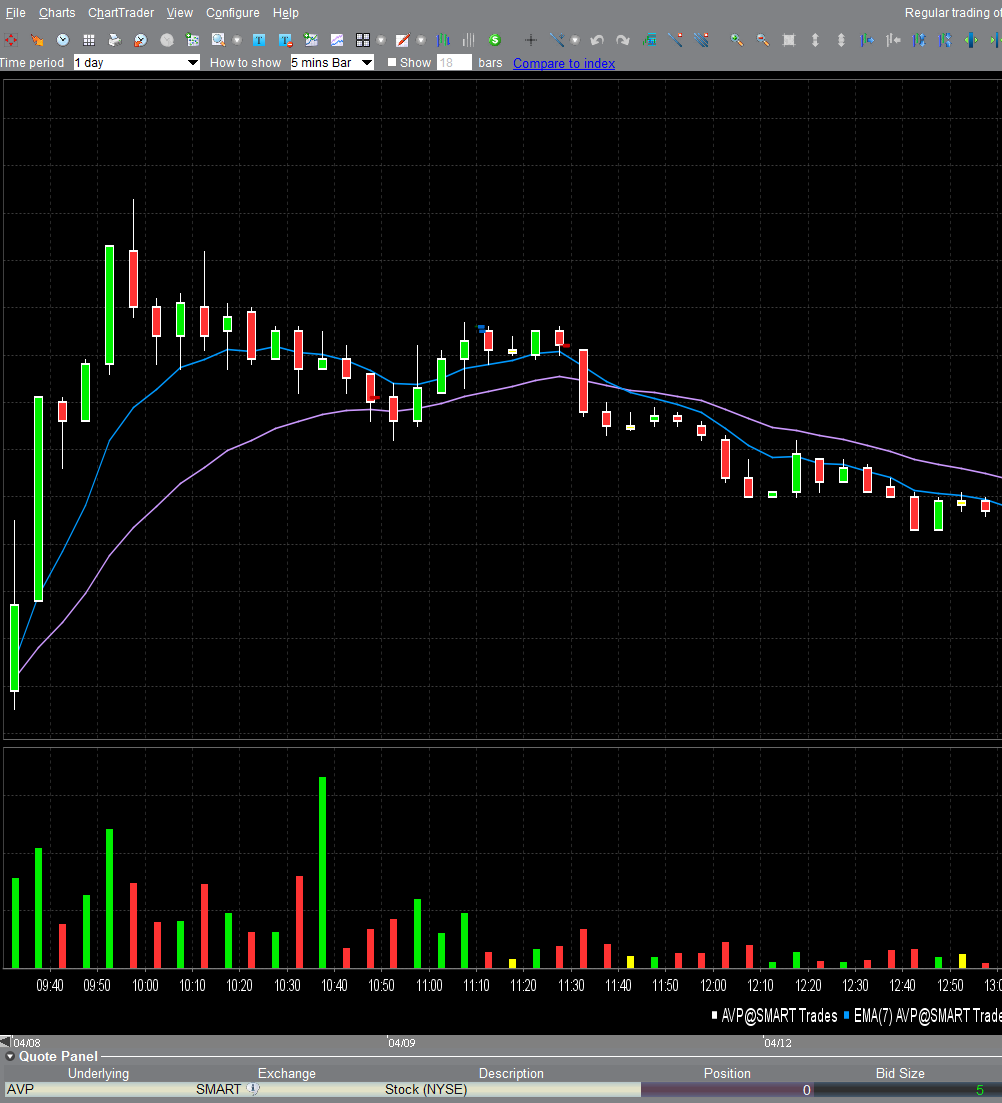
AVP... always reverse after the long candle. I couldn't make up my mind, and I found myself hoping for another rocket. Silly me. The reverses are almost - dare I say - predictable? I coulda/shoulda of played this like my ole geetar:


I tried a little too hard on CLF:


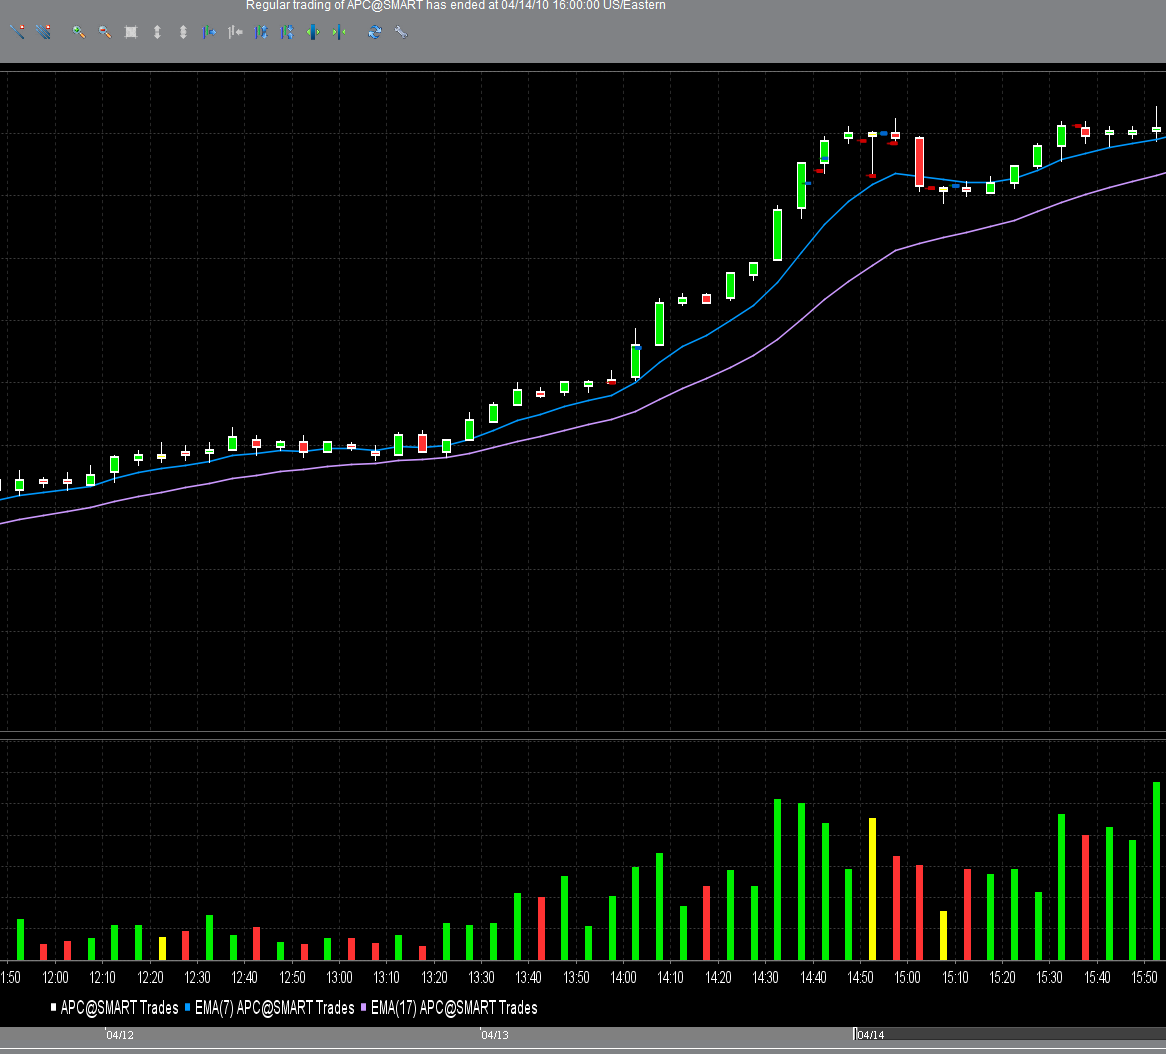
APC stopped out at 14:05 (a little late), tried to buy in at 14:35, and a click fest until 15:15, at which point I managed to tag along for a bit. I need to remember to just listen:


JOYG. I was too eager to read the reverse, and clicked in and out. Good clicking practice I suppose:


A new high on BHI, and a slight gain:


New low and AIG breaks my heart. I felt like minnow in the shark pen. Was not reading the action correctly. The yellow do nothing candle on low volume should have been the clue. If I remember correctly though, it started off green, coming off of the previous candle low:


Nice read on MHS. Slow and wave like. A little more confidence would have helped. But... I think I was trying a little too hard in the 15:30 bottom:


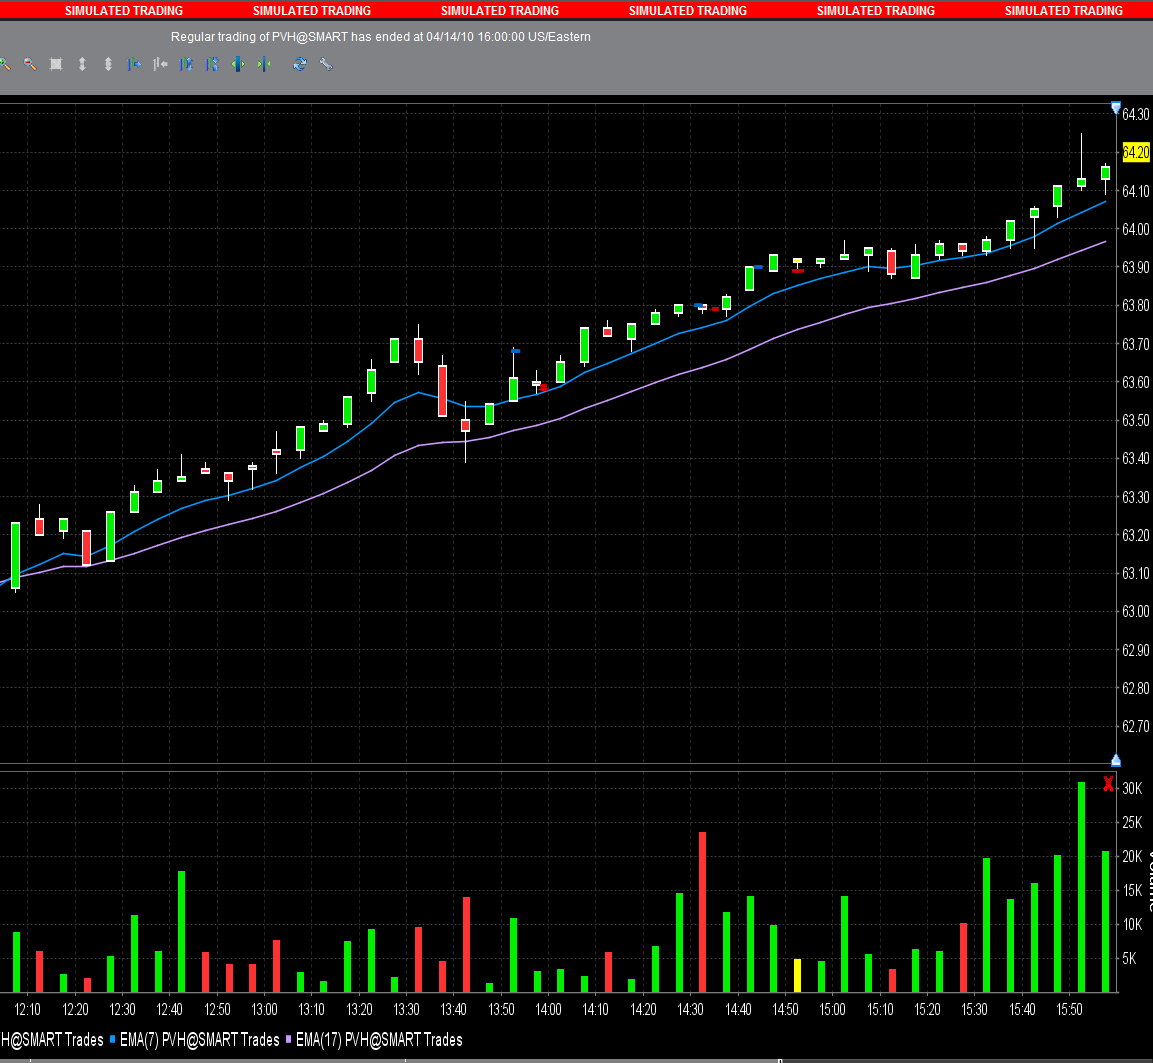
Failed at PVH, but good on the stops:


A failed new high on APH, but good tight stops:


MON; doubled at 14:45 on this one. I should have reversed on the next candle, but I was consumed with AIG at the time:


I think the afternoon session was a good response to the morning session. Today's lesson was one of constant vigilance. The morning saw me getting a little complacent - I was in the money, and for some reason just assumed I was in the slow trend of the day. Not a conscious thought, more of a relaxed 'I got this' attitude. This afternoon I did well enough, except on AIG. AVP was a gimme, but I felt some hope entering the picture. I was too quick on the draw for CLF and APC, especially given the relatively low volumes. The more clicks though, the more experience. Bound to get better.

Just glad this isn't real money =). Paper trading is offering a lot of freedom to move in and out. It feels good.

And here a >100 point gain on the DOW. Go figure. I thought I would have noticed more momentum bleeding over from QQQQ. I might need to check that out.

Dissertation research tomorrow, so no trading. Friday will be the money maker. Maybe.

Tuesday, April 13, 2010

End of Day Journal (4-13-2010)

I paper traded as fast as I could today.

I debated about whether or not try and be more judicious, and I decided not to. I ended the day about $800 to the negative. OSK kicked my butt. I look back at the chart and I wonder what the hell was I thinking. The flow and profit taking are right there for the whole world to see:


 I don't think I am going to trade on the live account until I get at least a good 3 days of not clicking sell when I mean buy. I might setup up distinct sell/buy hot key - click combos.

But I learned a few things today.

I think I am going to try and make it a point to chronicle my own personal definition of momentum, what it looks like, and what it feels like.

There are periods of excellent market momentum. When these occur, it is just a matter of jumping in and tagging along. Everything moves.

There is also intra-instrument momentums. Trends, reversals, and continuations. And a lot of it happens on the 5 minute candle (early morning insight via FnG).

Here is another FnG post that clicked home today after the close. OSK is an excellent example. Definite uptrend for the first hour, setting the tone for the day. The pull back at 10:20 with the near doji with strong volume at 11:00. The next candle starts green and ends green. This is a ~$0.50 move.

For the sake of posterity: I was watching OSK the whole time, but I waited to enter until the new high, missing most of the move (and to top it off, I clicked the wrong button, hence all of the other tightly packed entries and exits... I really need to setup that hotkey/click combo... silly me).

To recap - I should have been looking at the daily trend, watching and waiting for the continuation or the counter trend, and bought on the signal. Easy peasy - and back to FnG's notes: the stock is making up its mind at this time of the day - what is it going to do the rest of the day? It kind of holds this trend, and then towards the end of the day makes another decision. That is beautiful.

Another good example with SLG:


(Of course I flubbed it up very badly - something like 10 incorrect entry clicks until the end of the day... pfft.)

You can see I tried to enter the new high at 11:15, which is all well and good, but plenty of big green candles with stronger cumulative volumes before my entry.

It seems intra-instrument momo is more about expecting that a stock is going to move, and watching for the direction that it wants to go, usually after it takes a breath.

Then we have REG:


New highs. Breath. New highs, breath (and low volume breaths). Not selling on the high volume - near doji was a mistake, as evidenced by the 'Hi I'm red - nice to meet you' candle at 14:10.


Well anyhoo - it is just good for me to work these things out. Old news to experienced traders, but it feels like an epiphany of sorts for me. A lot of the stocks I traded today have the same type of clock patterns. I don't have yesterday's list of watches, so I haven't checked them, but I bet they did the same thing.

So tomorrow I will try to put this to practice. And trade out the gonzo again.