"An expert is a man who has made all the mistakes which can be made, in a narrow field."

- Niels Henrik David Bohr
Showing posts with label edge. Show all posts

Sunday, November 21, 2010

Weekend Edition (11-20-2010)

I have noticed that I have at least two bad entry habits that consistently eat into the daily profits:

  • Entering on a non-moving stock
  • Exiting early on a big trend and trying to reverse

I decided to spend part of the weekend trying to come up with an approach that would reduce my tendency to trade those types of price environments. While realizing the problem over the last week or so, and trying to figure out a solution, it became painfully obvious that my current simple/naive approach to establishing entries/exits doesn't offer much in the way of discretionary tools.

I thought about it. And thought about it some more. And then I decided that I really needed to come up with  an objective and quantifiable 'something or other' as an indicator of the current price environment. Something to give me the 'green light' to look for an entry.

So I came up with two ideas - one addressing my psychological framework, and one addressing my technical framework.

As to the psychological framework


This is the most important thought of the weekend.

I feel that I need to be ready to admit that I cannot trade like Scott; as much as I would like to be able to, and hopefully eventually will be able to, it is way beyond my current skill level. Scott has an amazing sense for the trade, honed by years of experience and an ability to focus. Sometimes I do very well reading momo, but there are enough times (as evidenced over the last few weeks of live trading) where I fall pretty flat and rapidly cut into my profits

After I stopped to think about some of this, I was surprised at how often 'pretending to be as good as Scott' gives me permission to make some entries. What I mean to say is he is able to time exits and reversals so un-canningly perfect at times that I think I should be able to as well: 'This looks right, I am just going to go for it and see what happens.' In a way, admitting this is about giving myself permission to slow down, lowering some immediate expectations, and taking more time and thought to analyze/observe price environments.

As to the technical framework


I wanted to keep this as simple and naive as possible. In a nutshell - I decided to go with the trend and the big movers. I am going to limit trades to big movers and use the color of the MA's on both the short and longer ranges as the quantifiable measure of the trend.


Entries
  • Do not trade prior to 10:00 a.m. ET.
  • Limit trades to the 5 stocks with the highest ATR values.
  • Only trade in the color direction of both the short and long range charts (blue is long, red is short)
    • Enter when the price crosses the short range MA, with the color of the short range MA matching the long range MA
    • Watch for end of trend signals:
      • Extremely high/low volumes, wave count (5/3 wave)
  • Place stops on the closest prior S/R


Exits

  • Draw lines from the start of the move to the top/bottom of the first correction for exits
    • Draw a new line if the slope of the trend changes
    • Exit when a bar on the dominating chart closes below the line 
  • Watch for end of trend signals:
    • Extremely high/low volumes, wave count (5/3 wave)

Here is an example of a legitimate trade on AAPL: 


Yellow lines are the wave count, red lines are exit lines, red diamond is entry, red dot is exit. Here is the setup on the 20 range (which, in my current setup is the shorter of the two range bars):

Entry:


Exit:


For a quick comparison - here are my trades on the 45 for the same day:


The same initial entry, but only one rather than 6 - only 3 of which did not get stopped out.


Reversals (i.e., trading against color on the larger range)

  • Only trade against color on the larger range when there is extreme high/low volume changes on the shorter range, and after the shorter range crosses the MA.

Here is a legitimate reversal on AAPL (11-16-2010)


Entry (note extreme volume at LOD):


Exit:


How This Compares


I picked two days worth of trades over that last couple of weeks: 11-10-2010 (i.e., the biggest losing day) and 11-16-2010 9the biggest winning day). I assumed that I would of been watching the same stocks and entered accordingly.

11/10/2010

There were no trades on TNA, RIMM, BIDU, SOHU,  PEGA, or GS using the probability criteria.

AAPL:

This was probably the most problematic of the bunch - especially with respect tot he 5/3 wave configuration. I kept the basic rules - and decided that the start of the new wave had to have at least 2 candles closing below the low of the peaking candle (of course it would be the opposite in a down trend).

The entry is at the start of wave 4 on the 45.


AIZ


CF


CMG


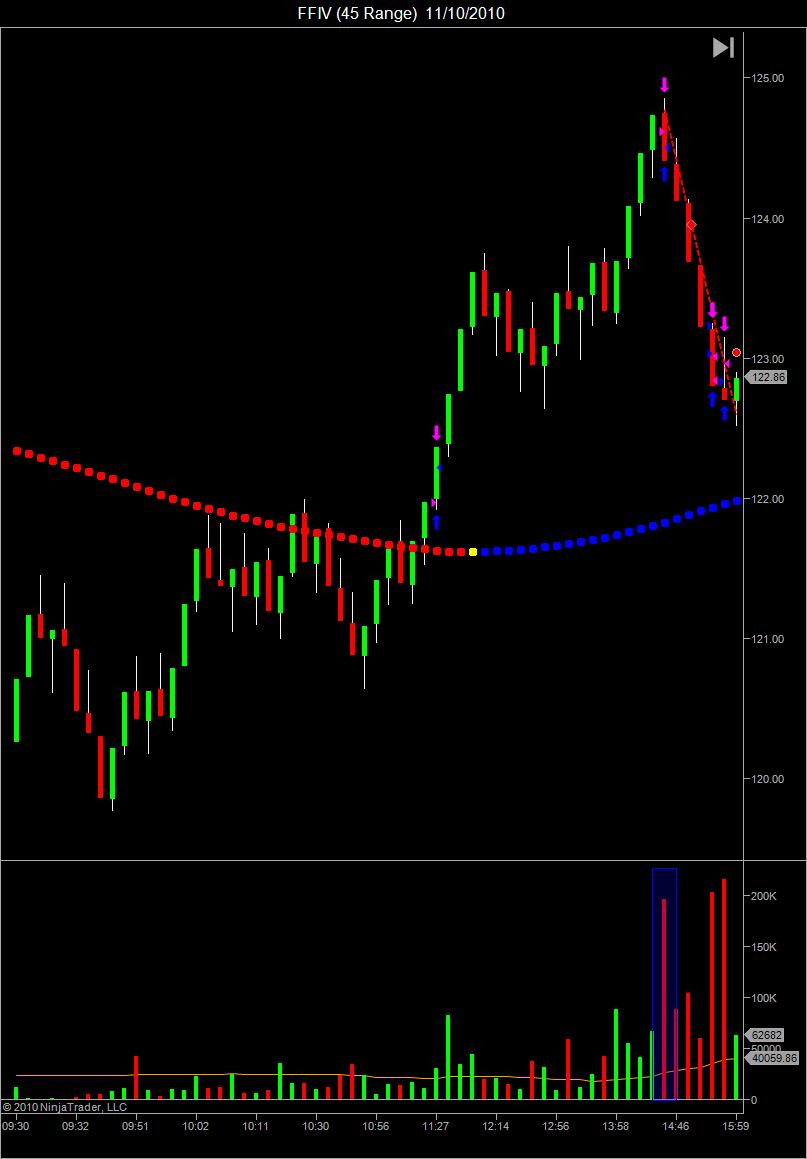
FFIV


NFLX

Two trades on NFLX.


Trade 1:


Trade 2 entry:


Trade 2 exit:


 PCP


2 stops on 8 trades, 6 trades were very profitable; compared to what NT calls 53 entries and exits.Of course this is no guarantee of what I would of actually done, but it is about as close as I can get.

11/16/2010

AAPL

Two trades on AAPL.

Again the 5/3 wave definition was a little problematic - but the fuscia line holds as wave 3 cannot be the shortest. Two of the corrective waves are on the verge of not being corrective at all, so it could of gone either way.


Trade 1:


Trade 2:


BIDU


CMG

Two trades on CMG.


Trade 1:


Trade 2 - stopped:


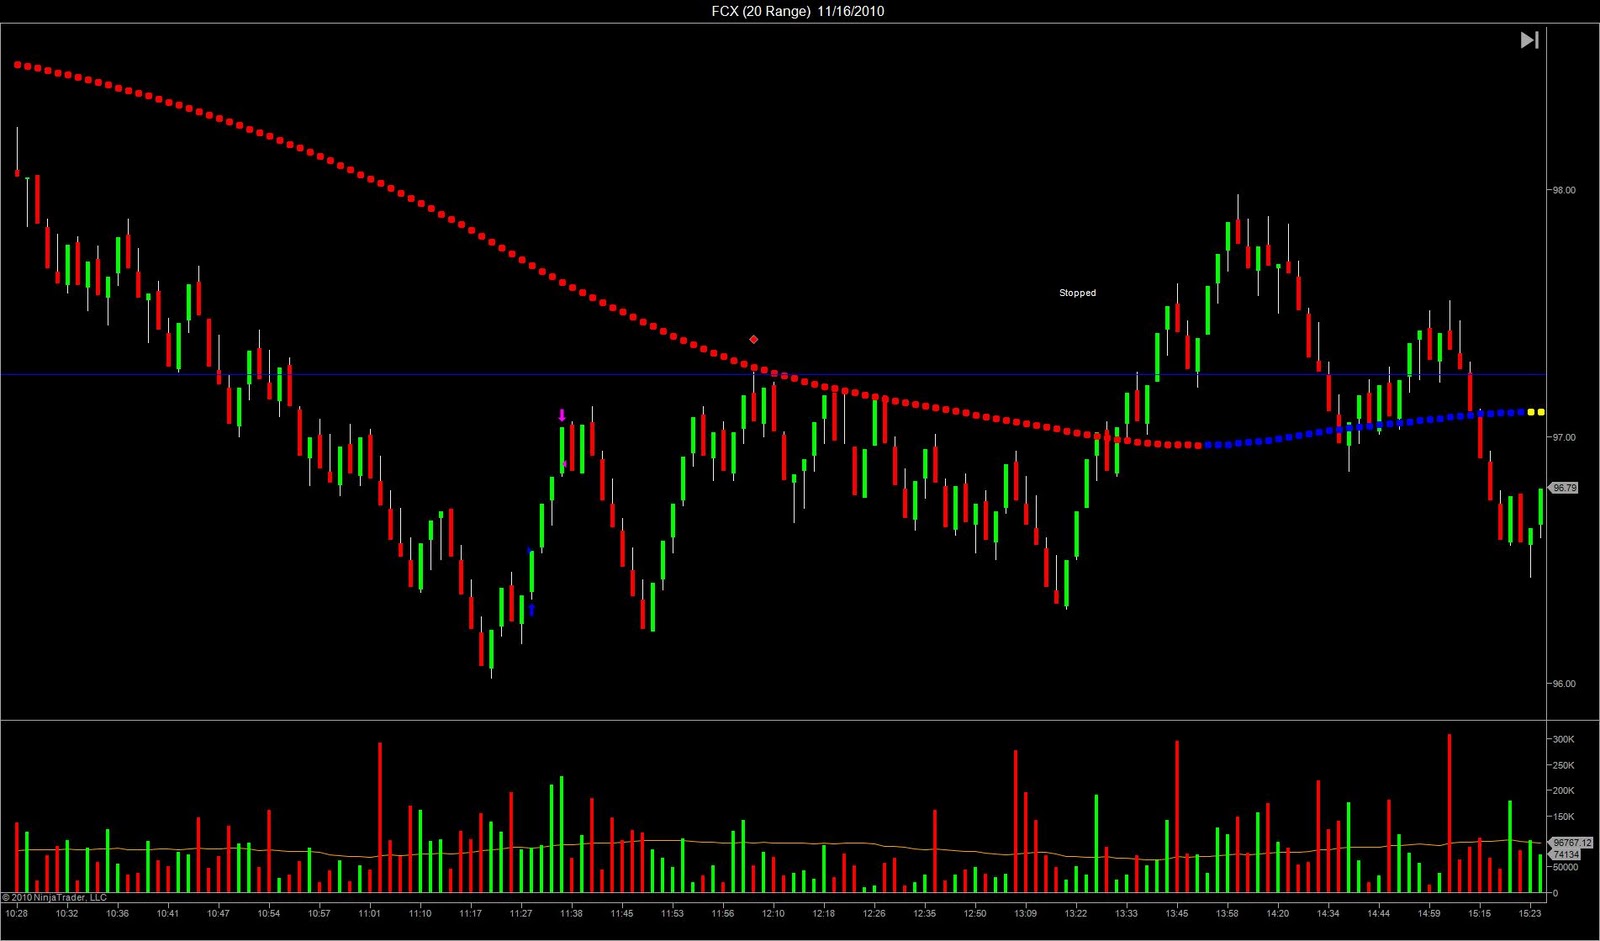
FCX


6 trades with 3 stops - but well over double the actual profit.

Final Thoughts


So far so good.

The bad thing? Well, perhaps not bad, but it was a little frustrating to realize that this is going to keep me out of some relatively big moves. For sure I have to be ok with this - I am coming to realize that missing big moves is likely and is not the end of the world. For now I have decided to accept that those moves and potential entry points are less probable.

Another question that comes to mind - what does this mean for my future as a trader? Am I limiting myself? Am I relying too much on indicators? Will this keep me from nurturing and relying upon my instinct?

I am not really sure. My hope is that this approach will make it 'safe enough' to continue to observe and learn. For the most part, the ability to grow my intuitive skills will have more to do with my attitude and how I see the 'technical framework': is this about safety and defining probabilities or is this about a rigid and conclusive methodology?

I have decided to 'test' this approach by trading live. As is evident from the two day review and the sometimes identical entries, this framework is a 'narrowing' of my current approach rather than a completely new ball of wax. The 'test' will mostly be about me and my ability to implement the trades with some degree of efficiency; i.e., trading the plan without exception. This will be the hardest part - and why I needed to address the psychological framework as well. Though it might sound a little silly, giving myself permission to be safe, lower my current expectations, and to continue to grow and learn, is a big step in the right direction.

Feedback appreciated.

Trade well.

Thursday, September 9, 2010

Flash Cards Etc.

I decided to relax today. I ended up spending some time with the market and getting some errands and chart gazing time in.

Scott's post today re. chart patterns was pretty insightful. And as it happened, the first trade on TNA using the patterns he outlined was a big winner (actually it was the second, because when it failed, I reversed). I spent some time this afternoon going thru several stocks and drawing lines. I came up with 64 flash cards. Some show patterns failing, some show patterns fizzling, some show patterns with big gains. Some don't show any patterns at all. I thought I would include those just as reminders that I should be selective.

I printed them to pdf and they are available for download here. They are all white background and printed with volume, 7 and 17 EMA's and the 15 minute candles. Unfortunately, they are not live shots, so they were all made in EOD context, but its a start. I added a few to this entry for a preview.

I plan on saving intra-day real time snapshots and building another portfolio that I can use for a new flashcard set.

I think I am going to spend the next several days looking for and trading stocks showing these patterns. For exits I am going to try and think of it as a learning experience, giving/allowing myself plenty of time to fine tune my exit strategy.

The patterns definitely change my perspective. I have always approached and studied Scott's entries/exits by focusing on the single candle (what made it special?) or looking at the one or two candles behind it. I moved from this to trying to reconcile/justify the entry/exit using the Q's and 15 minute candles. The patterns definitely broaden the 5 minute context.

I mean, I know this works...

Keep on trading.

Flash Card Examples:


Wednesday, September 8, 2010

Metric Schmetric

All right - so here is the deal. I traded today by sticking to the plan as well as I could. And all I got for it was a bunch of profit left on the table and a big (paper) hole in my pocket... I tried to ride the trend, bringing the trailing stop on the 15's and got burned pretty badly.

So - is this a problem with my edge? Or is it a problem with me?

I am sure I did over 20 trades today, fearlessly I might add, and I ended up negative.

Now what??

I look at Scott's trades today and I want to curl up in a little ball and suck my thumb. You can't put any metrics on what he did today on NZ and AKAM - not the 15, not the market (opposite directions, and relatively close to the same entry/exit times), not the EMA (Fozz got a fib to work on NZ) and both of them were spot on perfect. Maybe that is the problem - metrics and the objective rules I am trying to make.

According to Douglas, objective entries are the thing - objectively and apathetically trade my criteria. He doesn't mention exit criteria in that context though, he talks about scaled exits and accomplishing a 'risk-free' trade. I have been using an objective criteria. I am not quite ready to go the scaled exit setup, but that might be the thing.

Overall, I would say that I traded without expectations today. Perhaps the paper aspect of this (i.e., no monetary risk) is finally sinking in.

So that leaves the 'edge' (pfft.... what an edge...)

Here is a revision:

  1. 15 trend rules
  2. 5 signals the entry 
  3. 15 trend rules
  4. 5 signals the exit
  5. Enter when it looks like the trend is going to continue or reverse
  6. Exit when the trend looks as if it is spent
Maybe I can get past this 'metric' mindset and get into the flow. Do the best I can. Trade without fear and expectation. Afterall... it is only paper.

Trade well....

Thursday, September 2, 2010

My Edge (revised 9-2-2010)

A few words before I present the revised trading plan/edge.

I want to be careful to avoid what has been my tendency: blaming the system rather than the person applying the system; and all that implies. Looking back at today, it is pretty clear that the plan was not applied properly, and that if it would of been things would of worked out pretty well. Two things came into play - I was doing research for my dissertation today while trying to trade, and I had 8 consecutive stops. I am not sure how much each of these contributed to the poor decisions I made today, but I would like to address both of them as part of the plan revision.

By consecutive stop number 5 today I was taking things personally. In an effort to avoid this: whenever I have 3 consecutive stops, I will take time to re-focus on the goal of being a consistent trader by reading Douglas' book (page 200), the 5 fundamental truths, and the 7 principals of consistency.

And... no more trying to do dissertation research while trying to trade. I was pretty stoked because my advisor and I decided on a direction for a topic yesterday (finally) and I am more than ready to close this chapter of my life (and move onto trading). So I was up late last night doing reasearch and thought I could continue the track today.When I told my wife over a quick lunch break that I had been stopped 4 times she said 'Well, you shouldn't be doing your research while trading.' Pfft. What does she know?

Evidently, a lot more than me. Until I can become consistent, the only allowed reading is Douglas' book, the 5 fundamental truths, and the 7 principals of consistency.

I was tempted to allow for some discretion (e.g., to avoid entries like the first one today - that I knew before I entered was doomed), but I decided against it, at least for the time being. I can't be sure at this point whether it is what I am actually seeing or what I want to see that I am responding to. So for now, no discretion, simply the plan:


My edge:

Only trade in the direction of the 15 minute trend (higher highs, higher lows = uptrend; lower highs, lower lows = downtrend). The 15 minute trend (or doji 'change of trend' signal) always dictates the direction of trade.


Enter a trade when there is a retracement to prior S/R on the 5 minute candle chart. The 5 minute candle should show indecision (long wicks), and the indecision should mark the return to or start of the intraday (15 minute) trend.


Stops are placed $0.03 off of the prior S/R, prior H/L or $0.11 from entry, whichever is greater.
If a trailing stop is triggered (15 min candles), consider reversing position.


Move the stop in step with the just completed 15 minute candle H/L.


Exit on the largest 15 minute candle of the day and declining volume on the 5 minute candle or when stopped.


When I have 3 consecutive stops in a row, I will re-focus on my goal of being a consistent trader by reading page 200 of Douglas' book and the 5 fundamental truths and 7 principals of consistent trading.


Not much different, a little more emphasis on the 15 minute.

Part of me reacts to such a regimented approach - but if Douglas is correct, the essence of all this is simply the practice of self-discipline: '...a mental technique to redirect (as best we can) or focus of attention to the object of our goal or desire, when that goal or desire conflicts with some other component (belief) of our mental environment.' And I want to be a consistent trader.

Monday, August 30, 2010

End of day journal (8-30-2010) (Trading in the Zone Part 5)

I didn't much accomplished strategy wise this weekend. It felt overwhelming - I was tired and every time I sat down to try and figure something out, nothing seemed to click. It is easy for me to venture down the slippery slope of trying to make my edge/system 'full proof', finagling the details and rules in an attempt to catch everything. Exhausting.

That is the engineer in me coming out. And that is me denying the true nature of the market.

Fozzking posted a good read over on his blog that helped to point me in the right direction this morning. An interesting quote:

"...everyone I have spoken to that has read ‘Trading in the Zone’ raves about it. Yet, I only know of one person, in the many hundreds that I have spoken to, that has actually completed the Trading Exercise on pages 189-201 in the book."

Yipper. That is me. I made an effort last week, but I think I lost sight of the true nature and goals of the exercise. Fozz pointed out:

"This excercise is not about system development and it is not a test of your analytical abilities."

And in the next paragraph:


"In fact, the variables you choose can even be considered mediocre by most traders' standards, because what you are going to learn from doing this excercise is not dependent upon whether you actually make money. If you consider this exercise an educational expense, it will cut down on the amount of time and effort you might otherwise expend trying to find the most profitable edges." (Page 190, emphasis added.)

I think my 'edge' was simply too complicated (probably because I tried to make it fit every situation - as fozz also pointed out today - 'We just need to be comfortable with the fact that we are going to miss some big moves.') This had me focusing on profit rather than the goal of the exercise - which is "...to convince myself that trading is just a simple game of probabilities..." (pg. 189).

So - newly re-vamped and more trend friendly:

 My edge:
  • Only trade in the direction of the 15 minute trend (higher highs, higher lows = uptrend; lower highs, lower lows = downtrend)
  • Enter a trade when there is a retracement to prior S/R on the 5 minute candle chart. The 5 minute candle should show indecision (long wicks) and close on the direction side.
  • Stops are placed $0.03 off of the prior S/R, prior H/L or $0.11 from entry, whichever is greater.
  • If a trailing stop is triggered (15 min candles), reverse position.
  • Move the stop in step with the just completed 15 minute candle H/L.
  • Exit on the largest 15 minute candle of the day and declining volume on the 5 minute candle or when stopped.

I did a few candle by candle runs this afternoon - scroll to a random day, scroll the chart candle by candle until the 15 minute trend is identifiable, then watch and wait for the retrace and pause around prior S/R. Then move the stop down as 15 minute candles are completed. Exit when stopped or the exit criteria is met.

For the purpose of the exercise, I decided not to indicate a maximum stop or how to add.

Here is how the days came out:


Much fewer trades and not a lot of room for discretion. Good enough for me.

Trade well.

Wednesday, August 25, 2010

End of Day Journal (8-25-10)

Summary:

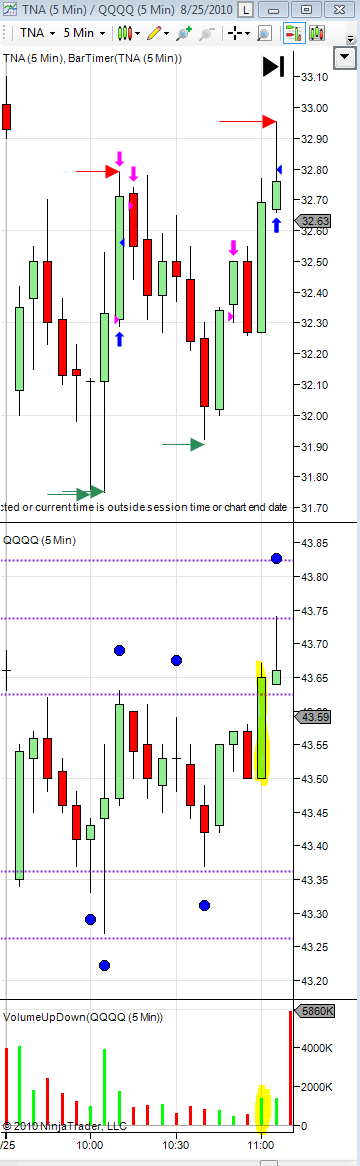
Finished the day at -$188.50 (same gig):


So - finished at -$0.94 per share.

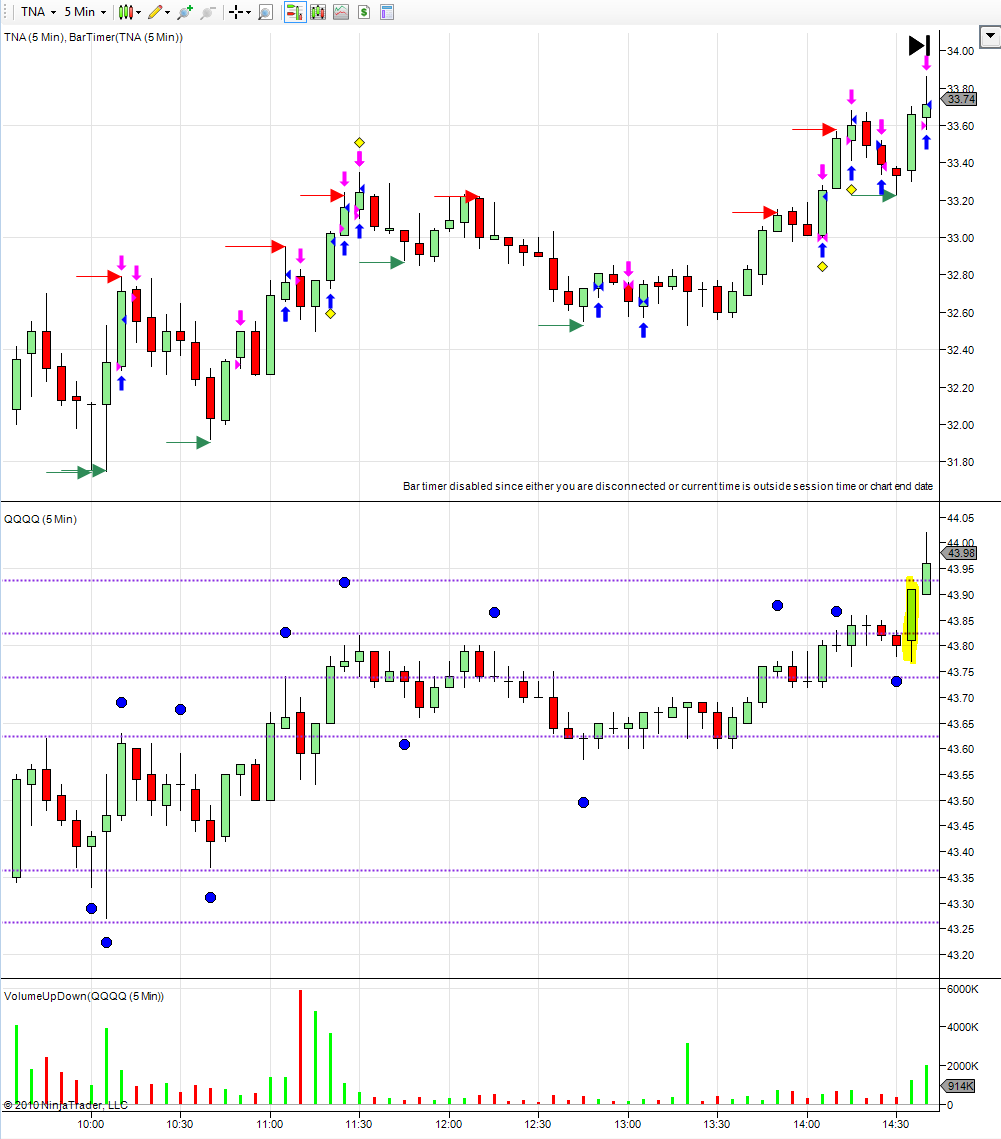
Here is the EOD application:


Off by something just under $2.80 per share. Un-believe-able.

Honestly, I am sitting here trying to figure this out. To re-cap, here is how the EOD is applied:

  1. I take out the rules.
  2. I mark S/R on the Q's.
  3. I flag matching entry criteria on the Q's.
  4. I enter stop locations on TNA: the respective H/L either on the signal candle or just before.
  5. I place triggered stops on TNA.
  6. I calculate entry prices by using the opening price on the candle after the signal.
  7. I move to the next trade flag on the Q's or until TNA triggers a stop (if the stop is less than $0.10 from the entry price, I move the stop to $0.11 from entry).
  8. I use the opening price on the candle just after the signal or the stop to determine the close price.
  9. Repeat.
Seems as straight forward and as unbiased as can be. I make a special effort to 'fudge' the criteria as well - e.g., this seems close enough - I probably would of entered; even though I see the stop 2 candles away. Yet the difference between what I did when I am in the moment and invested in what is happeneing, and the EOD chart application is ridiculous.

I am telling you folks - bizzaro world.

And incredibly revealing. And incredibly encouraging!

I am go into detail on all the trades below, perhaps cumbersome, but if you want to help me figure it out give it a read. I feel that a reconciliation between what I expect and what I implement is crucial to my growth/progress as a trader. This is where its at: If I can bring these two approaches together then I feel like I can begin to hone that all powerful trader's intuition. I feel like the stark reality of what I try to do - and tell myself that I am doing - as compared to what I actually do,  is perhaps one of the most helpful and humiliating things I have tried to do. I am getting a true perspective of the problem.

And I am convinced that this is where everything comes together - the fragile emotional balance, bolstered by (eventual) confidence in my ability to apply my plan. The plan works - I can trade it on static emotionless EOD charts all day. I just need to train myself to do it while in the moment.

Emotionally... this morning was tough - I brought a lot of expectation (weakness in the market), which I managed to trade thru, but you can see the results for yourselves. Interestingly enough, I forgot about both the mantra and the trading rules after the first read, thinking that I 'knew' what they said - to my chagrin on both accounts.

Trade well!

Details:

After avoiding this type of in depth analysis for some time, I have decided to do it again. The difference between 'now' and 'then' is that now I feel I understand the true nature of the problem. Earlier I had some sense of where I needed to eventually be, but really no clue as to what my problems were - I thought it was a matter of super duper chart reading skills. Truth is, all the skill I need to have to make money I use on every EOD application. I could teach my sons how to do it in about 10 minutes and they would probably do just as well as I can.

The problem is the disconnect - as we were nearing the market close today, I thought that I had traded as well as I possibly could to the plan. I remember thinking that the EOD application was sure to lose money today. Pffft.

The way I see it, it can only be one of two things: either I am unconsciously biased with the EOD charts in front of me or I am unconsciously biased when I am emotionally invested in what is happening.

Here are the charts - you decide:


Blow-by-blow:

The first was on the 10:00 'good as it gets' doji. the candle changed and I was poised to enter the trade (long) and everything dropped like a rock (TNA dropped $0.41 in the first second), I saw this and I froze - I couldn't place the order:


Part of the hesitancy was due to the $0.34 stop and I was thinking along the lines of 'Ok - buy when it comes within $0.30 of the stop'; but I didn't stand a chance. After the volatility settled down, I looked at the candle and wasn't sure what to make of it. It was the longest bar of the day, spanning almost the entire breadth of the day's movement and I could see it doing anything (heh - go figure), so I decided to short. The plan strategy would of been to go long (long wick on the support side).


The second 'pertinent' decision came on the 10:40 'doji'. The candle formed with a longer lower wick then body and I recall thinking that this might be a good exit - but I attributed the 'might' to hesitancy and gave it a 'not sure means no' decision:


On the EOD application, I see this as a clear turn around spot and signal the trade. Josh did too. And comparing the candle to other signals that I marked, it is is well within tolerances. Why didn't I think so live? I can tell you why: I was hoping that it would continue to go down and seeing what I wanted rather than seeing what was actually happening.

The next trade was following up on this one - I added prior to my short position. Things looked good. BUT the candle had 10 seconds left - I entered and wow did the chart look different by the time the candle finished:


And of course after the candle was finished I had no place to move the stop to, so I left it where it was - for a total loss of $0.48 per share on 400 shares.

Another trade was shortly after this - big candle on the 11:00:


In the moment, I thought that the market had no clear direction, so high (exhaustion) volume didn't apply. EOD of course I see market strength for the rest of the day and don't flag an entry until the following candle. But - it could be argued that strength was apparent: Q's broke new highs on the candle. I could go either way - but I will try to consider that in the future.

I missed the next two signals (long on the 11:45 and short on the 12:15), I was short the entire time - after getting stopped out twice:


EOD I get stopped out once but get back in on the long signal. I will avoid 'getting back in' from now on, at least until I get some consistency between the live and EOD application.

I nailed the next entry. But - then I exited on the very next doji:


The exit is not on the EOD because it was not in plan: the long wick was away from S/R... strict application versus 'I don't know what the hell I am doing' application.

I did go long on the next 'doji' with long side S/R, but missed the EOD exit:


This could be a matter of EOD bias, but a trading friend of mine (Fozz) saw the short signal as a get out while live - and my EOD application did not hesitate at all. This didn't have a drastic affect on the PnL differences though, the EOD goes short and gets stopped out. What did hurt was the fact that I took the long top wick as a signal to go short - which was completely out of plan. I do get a point here for trying - it had slipped my mind that I needed the S/R support on the long wick. In fact - I recall thinking 'This looks like it is going to go up, I am crazy to short it', but I countered with 'Gotta follow the plan'. Too bad it was the wrong plan.

In all fairness, the first EOD application missed the next two entries (this has happened every time after I give a close review and I have always corrected the EOD application). I actually nailed the first one live, but missed the following (the 14:30 long, I tried to go long on the 14:20 which was out of plan - the wick offers no definition of direction (see note at the end of the blog where I pick it apart)). The highlighted is the signal, the red is the false, and the green is another signal. Granted - the green circle is a tough call, but here is how it is (and what I intend on following from now on) - the candle is very close to S/R (that line could be moved down in light of the 12:05 and 12:10) and the lower wick is just as long or longer than the body. It doesn't matter a lot, but I figured that since I was picking apart the prior signals, I may as well decide something here as well:


This improved the EOD application significantly (meaning my live performance is even worse... pffft), but later additions to the EOD canceled it out and then some.

My next entry was based on the 'big green' and botched. Not enough volume and more than enough strength to see in the market. Plus I waited and let the candle turn red before making up my mind (thus shorting at almost the low):


I missed the next two signals also on the first EOD pass, and for the sake of consistency went ahead and added them. I missed the first one while live (even split on the wick/body and the strength of the day) but traded the second:


The next two trades are in line with the EOD application, and I came in late on the next trade. There is no S/R here until the bottom side doji forms, so the prices on EOD are a little generous. This finishes up the day:


Note:


Ok - after much deliberation, beating it to death, and wondering all along if all this is very helpful and good for the 'go by your gut' discretionary trader that I want to be... I decided it was and got something figured out.

(And for those of you who didn't read the blow-by-blow above, this has to do with the signal on the 14:20 and why it 'matters'.)

Here is the trade (circled in red); a similar - but distinguishable - signal is circled in green (red == no signal; green == signal):


Both of these have the doji with the long tail 'bouncing' off the S/R. the difference is the candle prior and suggested price direction. The green signal is pushing off of nearby resistance with the end of the wick coming close to (i.e. exceeding the prior H/L). This makes it valid in my opinion. The red signal is pushing off nearby support, but the low wick is no where close to (i.e., exceeding the prior H/L). In my opinion, this makes it invalid.

Now - this probably has nothing to do with anything, and perhaps neither represent a higher probability trade, but I had to decide something so I know what to do next time. In my opinion this decision makes some sense and is the most consistent with what I have chosen to define as my edge.