- Entering on a non-moving stock
- Exiting early on a big trend and trying to reverse
I decided to spend part of the weekend trying to come up with an approach that would reduce my tendency to trade those types of price environments. While realizing the problem over the last week or so, and trying to figure out a solution, it became painfully obvious that my current simple/naive approach to establishing entries/exits doesn't offer much in the way of discretionary tools.
I thought about it. And thought about it some more. And then I decided that I really needed to come up with an objective and quantifiable 'something or other' as an indicator of the current price environment. Something to give me the 'green light' to look for an entry.
So I came up with two ideas - one addressing my psychological framework, and one addressing my technical framework.
As to the psychological framework
This is the most important thought of the weekend.
I feel that I need to be ready to admit that I cannot trade like Scott; as much as I would like to be able to, and hopefully eventually will be able to, it is way beyond my current skill level. Scott has an amazing sense for the trade, honed by years of experience and an ability to focus. Sometimes I do very well reading momo, but there are enough times (as evidenced over the last few weeks of live trading) where I fall pretty flat and rapidly cut into my profits
After I stopped to think about some of this, I was surprised at how often 'pretending to be as good as Scott' gives me permission to make some entries. What I mean to say is he is able to time exits and reversals so un-canningly perfect at times that I think I should be able to as well: 'This looks right, I am just going to go for it and see what happens.' In a way, admitting this is about giving myself permission to slow down, lowering some immediate expectations, and taking more time and thought to analyze/observe price environments.
As to the technical framework
I wanted to keep this as simple and naive as possible. In a nutshell - I decided to go with the trend and the big movers. I am going to limit trades to big movers and use the color of the MA's on both the short and longer ranges as the quantifiable measure of the trend.
Entries
- Do not trade prior to 10:00 a.m. ET.
- Limit trades to the 5 stocks with the highest ATR values.
- Only trade in the color direction of both the short and long range charts (blue is long, red is short)
- Enter when the price crosses the short range MA, with the color of the short range MA matching the long range MA
- Watch for end of trend signals:
- Extremely high/low volumes, wave count (5/3 wave)
- Place stops on the closest prior S/R
Exits
- Draw lines from the start of the move to the top/bottom of the first correction for exits
- Draw a new line if the slope of the trend changes
- Exit when a bar on the dominating chart closes below the line
- Watch for end of trend signals:
- Extremely high/low volumes, wave count (5/3 wave)
Here is an example of a legitimate trade on AAPL:

Yellow lines are the wave count, red lines are exit lines, red diamond is entry, red dot is exit. Here is the setup on the 20 range (which, in my current setup is the shorter of the two range bars):
Entry:

Exit:

For a quick comparison - here are my trades on the 45 for the same day:

The same initial entry, but only one rather than 6 - only 3 of which did not get stopped out.
Reversals (i.e., trading against color on the larger range)
- Only trade against color on the larger range when there is extreme high/low volume changes on the shorter range, and after the shorter range crosses the MA.
Here is a legitimate reversal on AAPL (11-16-2010)

Entry (note extreme volume at LOD):

Exit:

How This Compares
I picked two days worth of trades over that last couple of weeks: 11-10-2010 (i.e., the biggest losing day) and 11-16-2010 9the biggest winning day). I assumed that I would of been watching the same stocks and entered accordingly.
11/10/2010
There were no trades on TNA, RIMM, BIDU, SOHU, PEGA, or GS using the probability criteria.
AAPL:
This was probably the most problematic of the bunch - especially with respect tot he 5/3 wave configuration. I kept the basic rules - and decided that the start of the new wave had to have at least 2 candles closing below the low of the peaking candle (of course it would be the opposite in a down trend).
The entry is at the start of wave 4 on the 45.


AIZ


CF


CMG


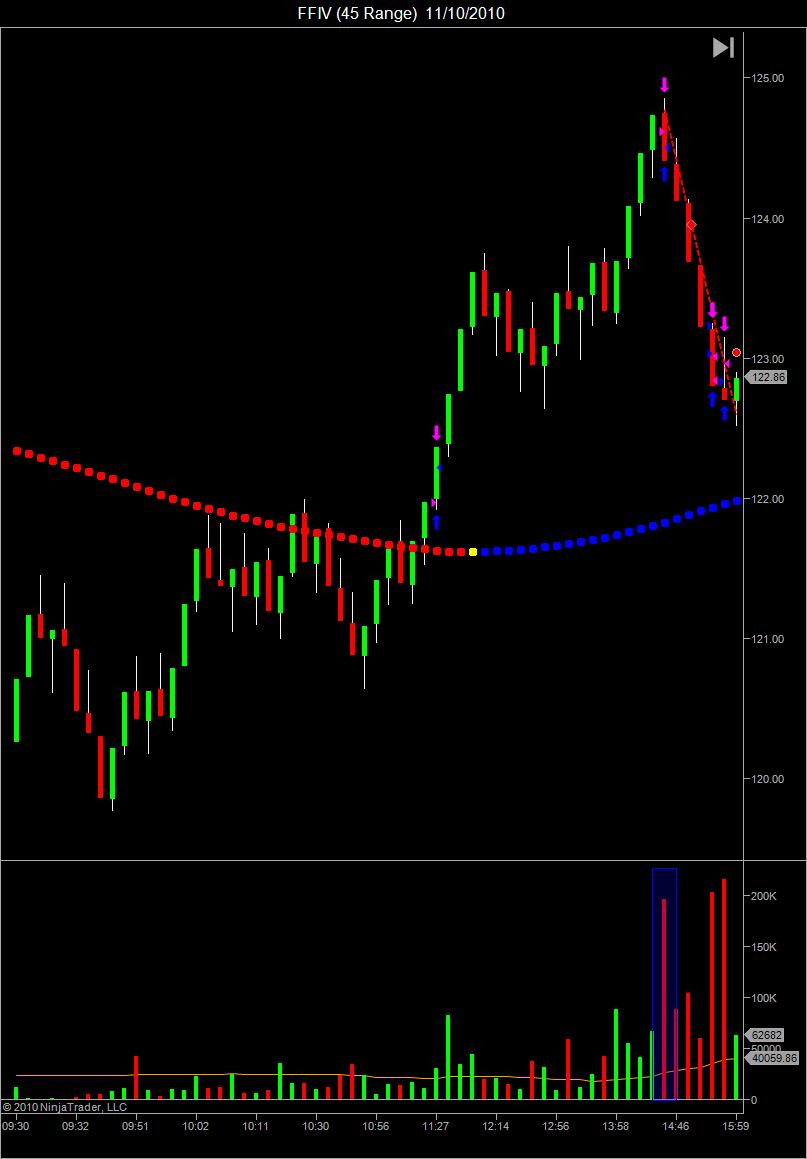
FFIV

NFLX
Two trades on NFLX.

Trade 1:

Trade 2 entry:

Trade 2 exit:

PCP


2 stops on 8 trades, 6 trades were very profitable; compared to what NT calls 53 entries and exits.Of course this is no guarantee of what I would of actually done, but it is about as close as I can get.
11/16/2010
AAPL
Two trades on AAPL.
Again the 5/3 wave definition was a little problematic - but the fuscia line holds as wave 3 cannot be the shortest. Two of the corrective waves are on the verge of not being corrective at all, so it could of gone either way.

Trade 1:

Trade 2:

BIDU


CMG
Two trades on CMG.

Trade 1:

Trade 2 - stopped:

FCX

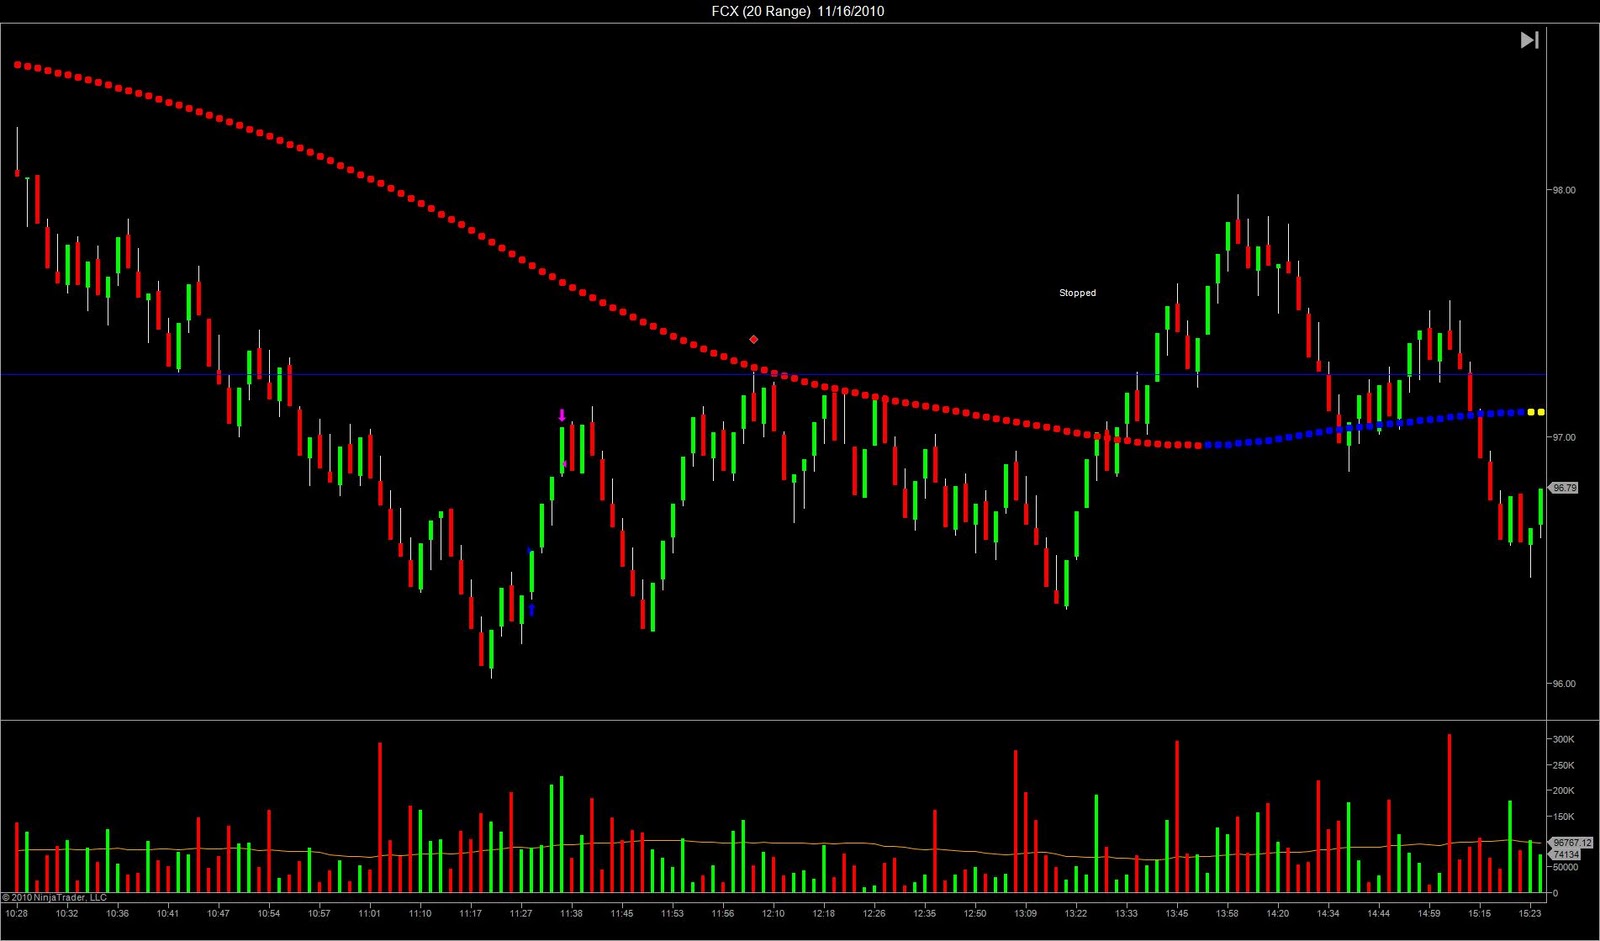
6 trades with 3 stops - but well over double the actual profit.
Final Thoughts
So far so good.
The bad thing? Well, perhaps not bad, but it was a little frustrating to realize that this is going to keep me out of some relatively big moves. For sure I have to be ok with this - I am coming to realize that missing big moves is likely and is not the end of the world. For now I have decided to accept that those moves and potential entry points are less probable.
Another question that comes to mind - what does this mean for my future as a trader? Am I limiting myself? Am I relying too much on indicators? Will this keep me from nurturing and relying upon my instinct?
I am not really sure. My hope is that this approach will make it 'safe enough' to continue to observe and learn. For the most part, the ability to grow my intuitive skills will have more to do with my attitude and how I see the 'technical framework': is this about safety and defining probabilities or is this about a rigid and conclusive methodology?
I have decided to 'test' this approach by trading live. As is evident from the two day review and the sometimes identical entries, this framework is a 'narrowing' of my current approach rather than a completely new ball of wax. The 'test' will mostly be about me and my ability to implement the trades with some degree of efficiency; i.e., trading the plan without exception. This will be the hardest part - and why I needed to address the psychological framework as well. Though it might sound a little silly, giving myself permission to be safe, lower my current expectations, and to continue to grow and learn, is a big step in the right direction.
Feedback appreciated.
Trade well.


